---
title: "AI Agent Observability, Tracing & Evaluation with Langfuse"
date: 2025/03/16
description: "Trace, monitor, evaluate, and test AI agents in production. Learn what agent observability is and how to use Langfuse with LangGraph, OpenAI Agents SDK, Claude Agent SDK, CrewAI, Pydantic AI, Vercel AI SDK, and more."
ogImage: /images/blog/ai-agent-observability/ai-agent-observability.png
tag: agents, guide, evaluation
author: Jannik
---
## What is AI agent observability? [#what-is-ai-agent-observability]
AI agent observability is the practice of capturing every step an AI agent takes, including LLM calls, tool invocations, retrievals, and control-flow decisions, as structured traces that you can inspect, filter, and evaluate. It extends LLM observability from single completions to multi-step, non-deterministic workflows, where failures usually hide in an intermediate step rather than in the final answer.
A complete agent observability setup captures:
- **LLM calls** are recorded with their prompts, completions, model parameters, token usage, and [cost](/docs/observability/features/token-and-cost-tracking).
- **Tool calls** are recorded with the tools that were available to the model, the tool it chose, and the arguments it passed.
- **Control flow** is visible: which subagents, handoffs, or loop iterations ran, in what order, and how often the agent looped.
- **Context** is captured: the prompt version, retrieved documents, and everything else the model actually saw at each step.
- **Sessions and users** group multi-turn conversations so behavior can be analyzed per conversation and per user.
- **Quality signals** such as [user feedback](/docs/observability/features/user-feedback) and evaluation scores are attached directly to traces.
[Langfuse](/) is an open-source AI engineering platform that implements this end to end: [tracing](/docs/observability/overview) with typed observations, agent graph visualization, tool-call analytics, production alerts, and [evaluation](/docs/evaluation/overview) on top of the captured data. The rest of this post walks through each of these capabilities and how to instrument the most common agent stacks.
## Why agents need dedicated observability
Agents differ from single-call LLM applications in three ways that shape what observability has to do:
- **Failures hide mid-trace.** An agent that picks the wrong tool, retrieves the wrong document, or loops on a failing step can still produce a plausible final answer. Finding these failures requires inspecting the full trace, and turning them into [dataset](/docs/evaluation/experiments/datasets) items so they stay fixed.
- **Agents decide their own spend.** An agent autonomously chooses how many model calls, tool executions, and external API calls a task takes, so cost must be tracked in real time, attributed per trace, per user, and per model.
- **Agents run long.** Plan-act-observe loops, subagent delegation, and long-horizon tasks produce traces with hundreds or thousands of observations, and teams running long-lived agents report traces reaching hundreds of thousands of observations. Tooling has to stay useful at that scale, which is why search, filtering, and aggregate views matter as much as the trace tree itself.
## How modern agents are built, and what that means for tracing
### The agentic loop and its harness
An agent today is a model calling tools in a loop: the harness assembles context, sends it to the model, executes the tool calls the model requests, feeds results back, and decides when the loop stops. Frameworks like LangGraph, the OpenAI Agents SDK, and the Claude Agent SDK are harnesses in this sense, and the industry has converged on **OpenTelemetry (OTel)** for emitting their telemetry. Many agent frameworks, including Pydantic AI, smolagents, Strands Agents, and LiveKit Agents, ship OTel instrumentation that [Langfuse natively supports](/docs/observability/sdk/instrumentation), which prevents vendor lock-in and lets you keep existing instrumentation when switching backends.
For observability, the loop is the unit of analysis: every iteration is a set of observations (a generation, its tool calls, their results), and questions like "why did the agent take 40 steps for this task" are answered by reading the loop, not the final answer.
### Tool calling and MCP
Tools are how agents act, and the [Model Context Protocol (MCP)](https://modelcontextprotocol.io/) has become the standard way to connect agents to external tools and data sources. When tracing MCP applications, client and server operations produce separate traces by default; Langfuse supports [linking them](/docs/observability/features/mcp-tracing) by propagating OpenTelemetry context through MCP's `_meta` field, so one request flows through client, server, and downstream APIs as a single connected trace.
### Subagents and multi-agent orchestration
Production agent systems increasingly delegate: a supervisor hands work to specialized subagents, the OpenAI Agents SDK models this as handoffs, and frameworks like [LangChain DeepAgents](/integrations/frameworks/langchain-deepagents) spawn subagents for research and critique. In a trace, each subagent's work nests under its parent as typed observations, so the delegation structure is visible in the trace tree and the agent graph. When the agents run as separate services, their spans are assembled into one trace via distributed tracing, covered [below](#assembling-multi-agent-and-distributed-traces).
### Context engineering
What an agent does is determined as much by its assembled context (system prompt, skills, retrieved documents, memory) as by the model, so two runs with the same user input can diverge purely because the context differed. Observability has to capture what the model actually saw:
- **Prompt versions** are linked to traces via [prompt management](/docs/prompt-management/features/link-to-traces), so quality metrics can be compared per prompt version.
- **Retrieved context** is recorded in `retriever` observations, with the query as input and the returned documents as output.
- **The full message history** sent to the model is the input of each `generation` observation, so the effective context of every step is inspectable after the fact.
### Coding agents
Coding agents are now a mainstream agent class doing real engineering work: they edit files, run terminal commands, and call MCP tools. Langfuse traces the major ones, including Claude Code and OpenAI Codex via lifecycle hooks, GitHub Copilot via its native OpenTelemetry export, and Cursor, Kiro, OpenCode, and Augment Code via dedicated integrations. Teams use these traces for debugging agent sessions, per-developer cost dashboards, and rollout governance; our guide on [tracing coding agents](/resources/engineering/coding-agent-tracing) covers setup for all of them.
## Structured tracing with observation types
Every step in a Langfuse trace is an observation with a semantic type. Langfuse supports 10 [observation types](/docs/observability/features/observation-types): `event`, `span`, `generation`, `agent`, `tool`, `chain`, `retriever`, `evaluator`, `embedding`, and `guardrail`. Framework integrations set these automatically; with the SDKs you set them explicitly:
```python
from langfuse import observe
@observe(as_type="agent")
def run_agent_workflow(query):
return process_with_tools(query)
@observe(as_type="tool")
def call_weather_api(location):
return weather_service.get_weather(location)
```
Typed observations make traces filterable ("show me all guardrail checks that failed") and they are what enables the agent graph view described next.
## Visualizing agent behavior with agent graphs
The [agent graph view](/docs/observability/features/agent-graphs) turns a trace into a picture of what the agent did: nodes for steps, edges for how execution moved between them. Langfuse infers the graph automatically from observation timings and nesting; it appears for any trace that contains an observation type other than `span`, `event`, or `generation`, and automatically for the LangGraph integration. It works with any framework or custom instrumentation.
Since July 2026, the graph view (currently in beta) offers two modes that answer different questions:
| | **Aggregated** (default) | **Expanded** ("as it ran") |
| -------------- | --------------------------------------------- | ------------------------------------------- |
| A node is | one unique step name | one individual call |
| Repeated calls | collapse into a single node with a counter | appear as separate nodes |
| Loops | drawn as cycles | unrolled into an acyclic graph (DAG) |
| Best for | grasping structure and complexity at a glance | following or debugging a specific execution |
**Aggregated** shows the agent's overall shape: `retrieve_docs (3/3)` means that step ran three times, and loops draw as cycles, so even a busy agent stays readable. **Expanded** shows the run step by step: every call is its own node and loops unroll in execution order, which is the right view for pinning down exactly where something happened. The layout is deterministic, so a trace draws the same way every time you open it.
## Monitoring tool calls
Tool calls are the core of agent behavior, so Langfuse treats them as a distinct data structure rather than raw JSON in a payload. It distinguishes **available tools** (the tools offered to the LLM) from **tool calls** (the tools the LLM actually invoked, with arguments).
This structure shows up in three places:
**1. In the trace view.** All tools available to an LLM render at the top of each generation, with called tools highlighted alongside their arguments and call IDs. You can see at a glance whether the model picked the right tool, and click any tool to inspect its full definition and parameters.
**2. In filters and dashboards.** The observations table can be filtered by tool-call count, available-tool count, and tool names, and dashboard widgets aggregate `toolCalls` and `toolDefinitions` metrics over time. This turns tool behavior into queries:
- Find looping agents by filtering for observations with 30+ tool calls but only 1 available tool.
- Find dead tools by filtering for observations where a tool like `get_weather` was available but never invoked.
- Audit tool scope by filtering for observations where a sensitive tool was actually called, and alerting on the result.
**3. In evaluators.** [Code evaluators](/docs/evaluation/evaluation-methods/code-evaluators) and [LLM-as-a-Judge](/docs/evaluation/evaluation-methods/llm-as-a-judge) evaluators access recorded tool calls through a structured `tool_calls` field (each call carries `id`, `name`, `arguments`, `type`, and `index`), so checks like "did the agent call `search` before answering" are one line of code:
```python
used_search = any(
tool_call.name == "search" for tool_call in ctx.observation.tool_calls
)
```
Tool-call parsing covers payloads from OpenAI, LangChain and LangGraph, the Vercel AI SDK, Google ADK, and the Microsoft Agent Framework, with support for further frameworks expanding (see the [changelog](/changelog/2025-12-22-tool-calls-filtering-visualization) for the current list).
## Debugging long agent traces
Production agent traces routinely reach thousands of observations, and long-horizon agents that plan, delegate, and retry can produce far more. At that size, scrolling a trace tree stops being a debugging strategy. Langfuse provides three tools for working with large traces:
- The **trace log view** concatenates all observation data of a trace into a single scrollable document, so you can skim an agent run chronologically or Ctrl+F through the entire trace to find a specific string inside a loopy, verbose agent.
- [Full-text search](/docs/observability/features/full-text-search) finds a keyword or phrase across the inputs, outputs, and metadata of all traces and observations in a project, which helps when you remember a piece of content but not which trace it belongs to.
- The **observations table** treats every LLM call, tool execution, and agent step as a row you can query directly. Filter by observation name, type, or model, sort generations by cost, or pull up all `ERROR`-level observations for one user, then save the view for one-click access. See the [guide on working with observations](/faq/all/explore-observations-in-v4).
## Assembling multi-agent and distributed traces [#assembling-multi-agent-and-distributed-traces]
When an agent system spans multiple services, for example a supervisor service delegating to specialized agent services, the individual steps only become one coherent trace if they share a trace ID. Langfuse supports this through [trace IDs and distributed tracing](/docs/observability/features/trace-ids-and-distributed-tracing):
- Propagate the trace ID across service boundaries via standard OpenTelemetry context propagation, and all spans land in the same Langfuse trace.
- Derive deterministic trace IDs from a seed, such as an external request ID, so any service (and any later system, like an evaluation pipeline) can compute the same trace ID independently.
- Link MCP client and server traces by carrying the trace context in the [MCP `_meta` field](/docs/observability/features/mcp-tracing).
- Group related traces into [sessions](/docs/observability/features/sessions) to follow a multi-turn conversation where each turn is its own trace.
Once assembled, the full multi-agent run gets the same treatment as a single-service trace: one trace tree, one graph view, one place to attach scores.
## Agent frameworks and how to trace them
You do not need a specific framework to build AI agents, and Langfuse is deliberately framework-agnostic: it accepts traces from its native SDKs, from OpenTelemetry, and from 100+ library and framework integrations. Below are the integrations we see used most for agents, as of July 2026.
### LangGraph
LangGraph ([GitHub](https://github.com/langchain-ai/langgraph)) is an open-source framework by the LangChain team for building complex, stateful, multi-agent applications. LangGraph includes built-in persistence to save and resume state, which enables error recovery and human-in-the-loop workflows.
LangGraph agents can be [monitored with Langfuse](/integrations/frameworks/langgraph), and the agent graph view renders the LangGraph structure automatically.
_[Example trace in Langfuse](https://cloud.langfuse.com/project/cloramnkj0002jz088vzn1ja4/traces/a8b0cc9e-da3b-485f-a642-35431a6f9289)_
### OpenAI Agents SDK
The OpenAI Agents SDK is a lightweight framework for building and orchestrating AI agents. By instrumenting the SDK with Langfuse, you can capture detailed traces of agent execution, including planning, function calls, and multi-agent handoffs.
For a setup guide, see [Trace the OpenAI Agents SDK with Langfuse](/integrations/frameworks/openai-agents).
_[Example trace in Langfuse](https://cloud.langfuse.com/project/cloramnkj0002jz088vzn1ja4/traces/019593c74429a6d0489e9259703a1148?timestamp=2025-03-14T08%3A31%3A04.745Z&observation=e83609282c443b0d)_
### Claude Agent SDK
The Claude Agent SDK is Anthropic's open-source framework for building tool-using AI agents, with native support for MCP. It emits traces via OpenTelemetry, so every prompt, model response, and tool call lands in Langfuse.
Setup guides are available for [Python](/integrations/frameworks/claude-agent-sdk) and [JS/TS](/integrations/frameworks/claude-agent-sdk-js).
### Pydantic AI
[Pydantic AI](https://ai.pydantic.dev/) brings Pydantic's type safety and ergonomic developer experience to agent development. You define your agent's inputs, tool signatures, and outputs as Python types, and the framework handles validation plus OpenTelemetry instrumentation under the hood.
For a step-by-step guide, see [Trace Pydantic AI agents with Langfuse](/integrations/frameworks/pydantic-ai).
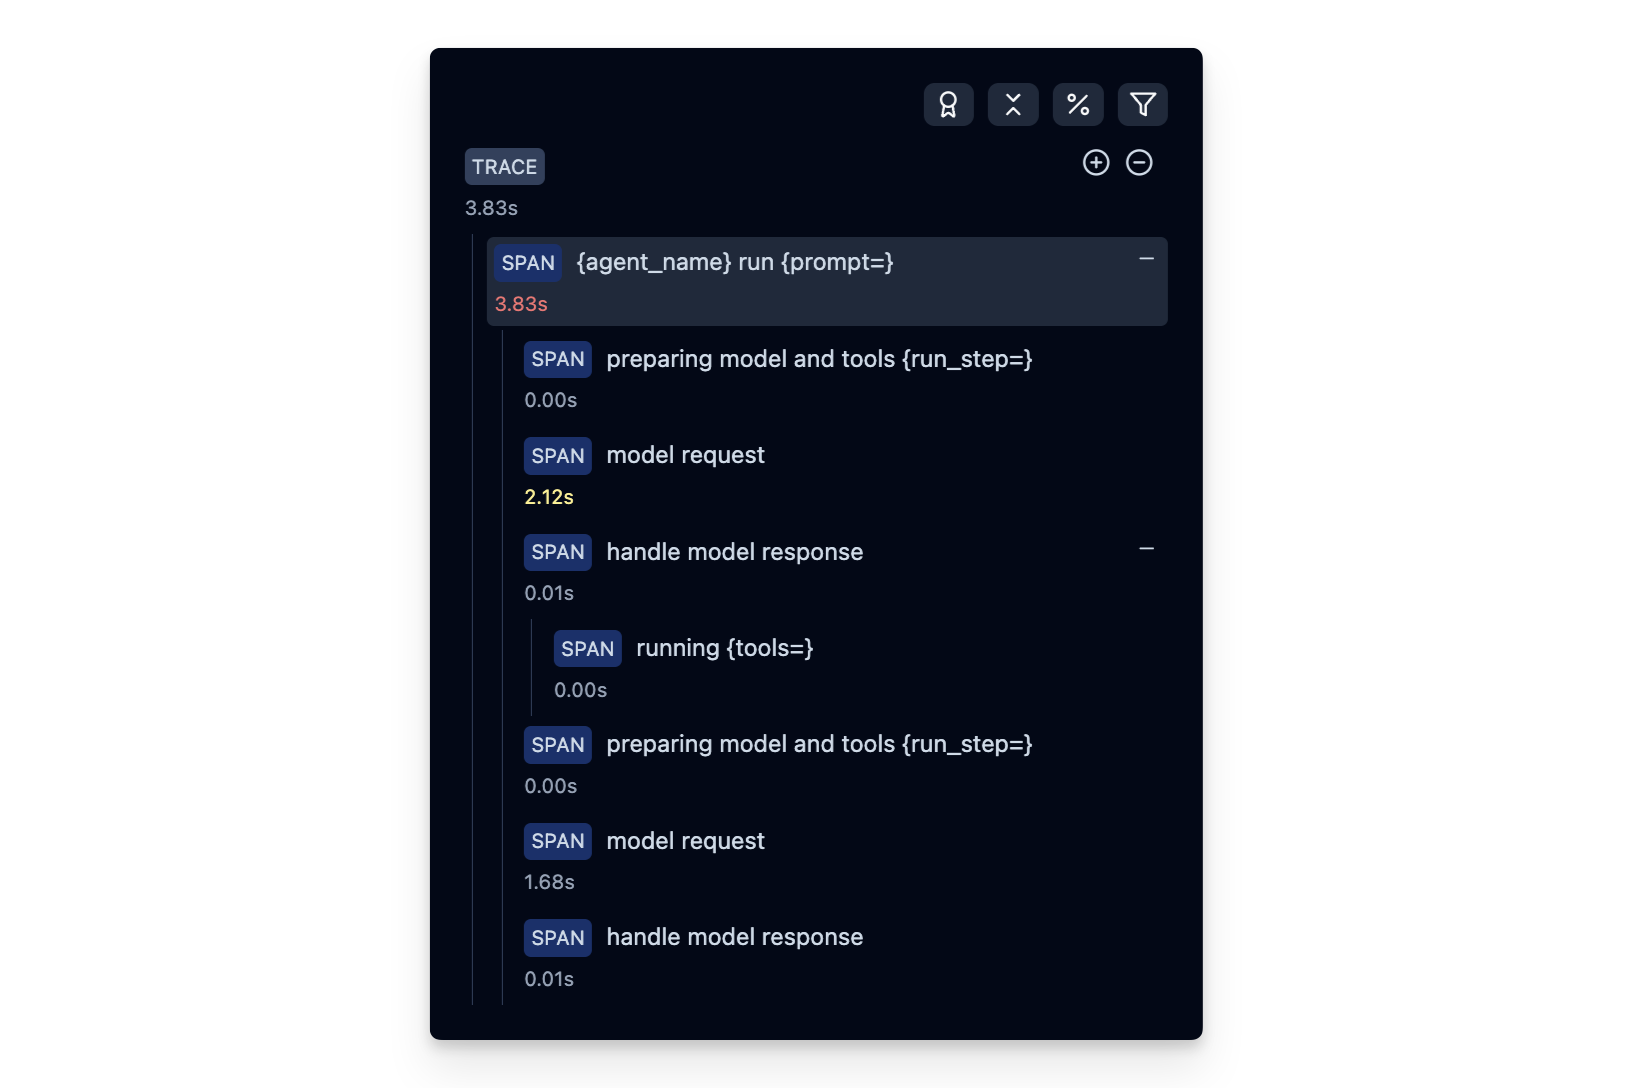
_[Example trace in Langfuse](https://cloud.langfuse.com/project/cloramnkj0002jz088vzn1ja4/traces/25f4bdeebaab60e6e1bee7e8469554bc?timestamp=2025-06-06T14%3A39%3A55.786Z&display=details)_
### CrewAI
[CrewAI](https://github.com/crewAIInc/crewAI) is all about role-based collaboration among multiple agents. You assign each agent a distinct skillset or role, then let them cooperate to solve a problem. The framework offers a higher-level abstraction called a "Crew" that coordinates workflows, allowing agents to share context and build upon one another's contributions.
For setup instructions, see [Trace CrewAI agents with Langfuse](/integrations/frameworks/crewai).

_[Example trace in Langfuse](https://cloud.langfuse.com/project/cloramnkj0002jz088vzn1ja4/traces/3b485ea0d723bab3e5e53e72c6b10a71?timestamp=2025-02-24T10%3A34%3A30.423Z&observation=0c53ff94ec9c3da9)_
### Vercel AI SDK
The Vercel AI SDK is a TypeScript toolkit for building AI applications and agents in Next.js, React, and Node.js, including tool calling and agentic loops. Its built-in telemetry integrates with Langfuse for full traces of generations and tool calls.
For setup instructions, see [Observability for the Vercel AI SDK](/integrations/frameworks/vercel-ai-sdk).
### Hugging Face smolagents
Hugging Face smolagents is a minimalist framework for building AI agents. By initializing the `SmolagentsInstrumentor`, your agent interactions are traced using OpenTelemetry and displayed in Langfuse.
For a step-by-step guide, see [Observability for smolagents with Langfuse](/integrations/frameworks/smolagents).
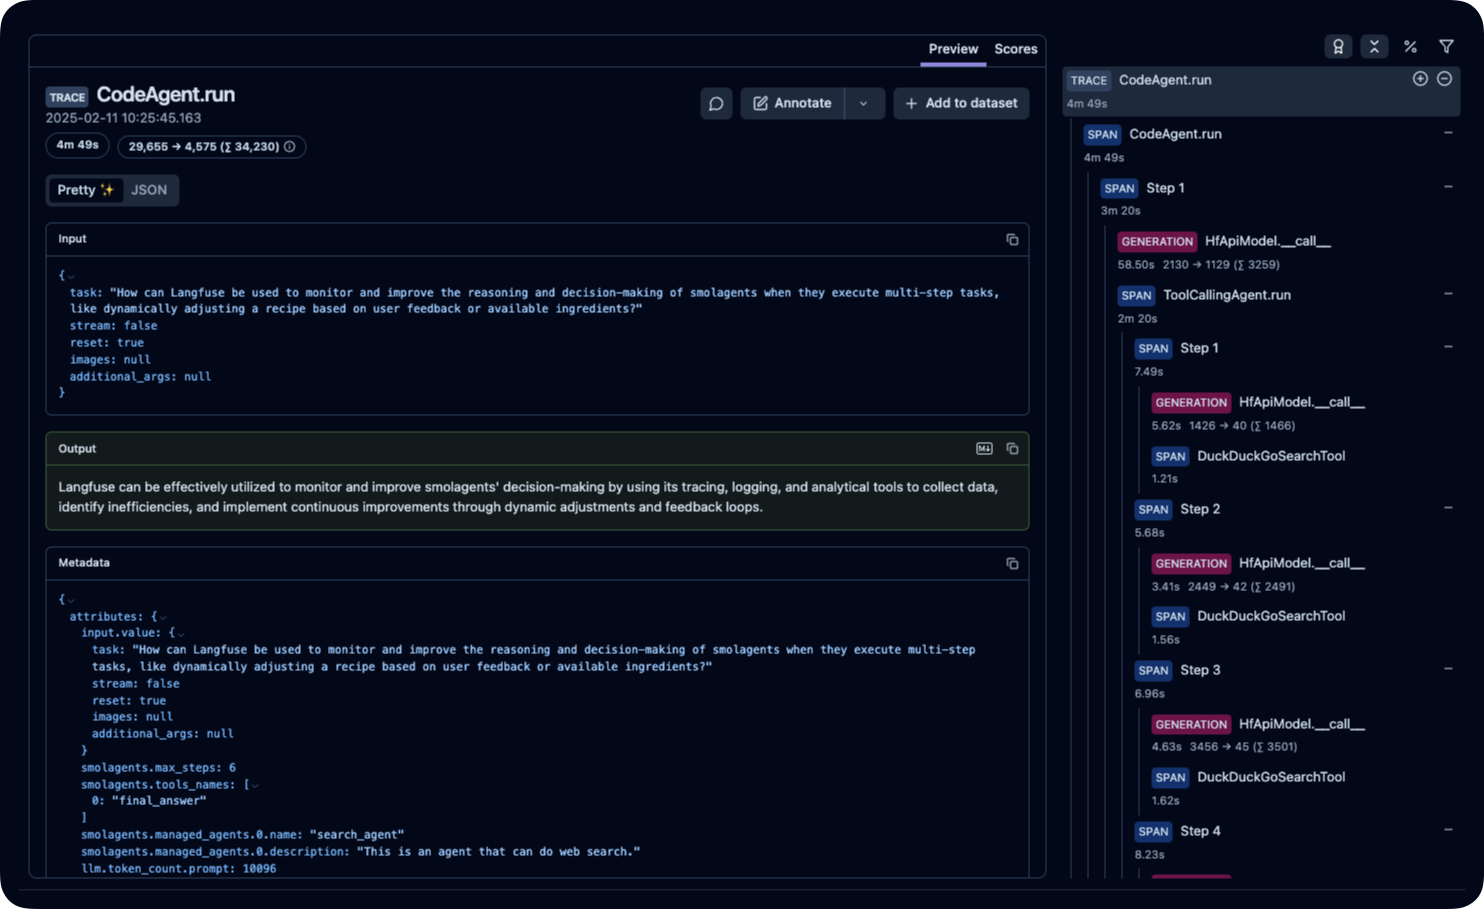
_[Example trace in Langfuse](https://cloud.langfuse.com/project/cloramnkj0002jz088vzn1ja4/traces/ce5160f9bfd5a6cd63b07d2bfcec6f54?timestamp=2025-02-11T09%3A25%3A45.163Z&display=details)_
### Strands Agents
[Strands Agents SDK](https://strandsagents.com) is a model-agnostic agent framework that supports multiple model providers including Amazon Bedrock, Anthropic, OpenAI, and Ollama via LiteLLM. It ships with first-class OpenTelemetry tracing.
For setup instructions, see [Trace Strands Agents with Langfuse](/integrations/frameworks/strands-agents).
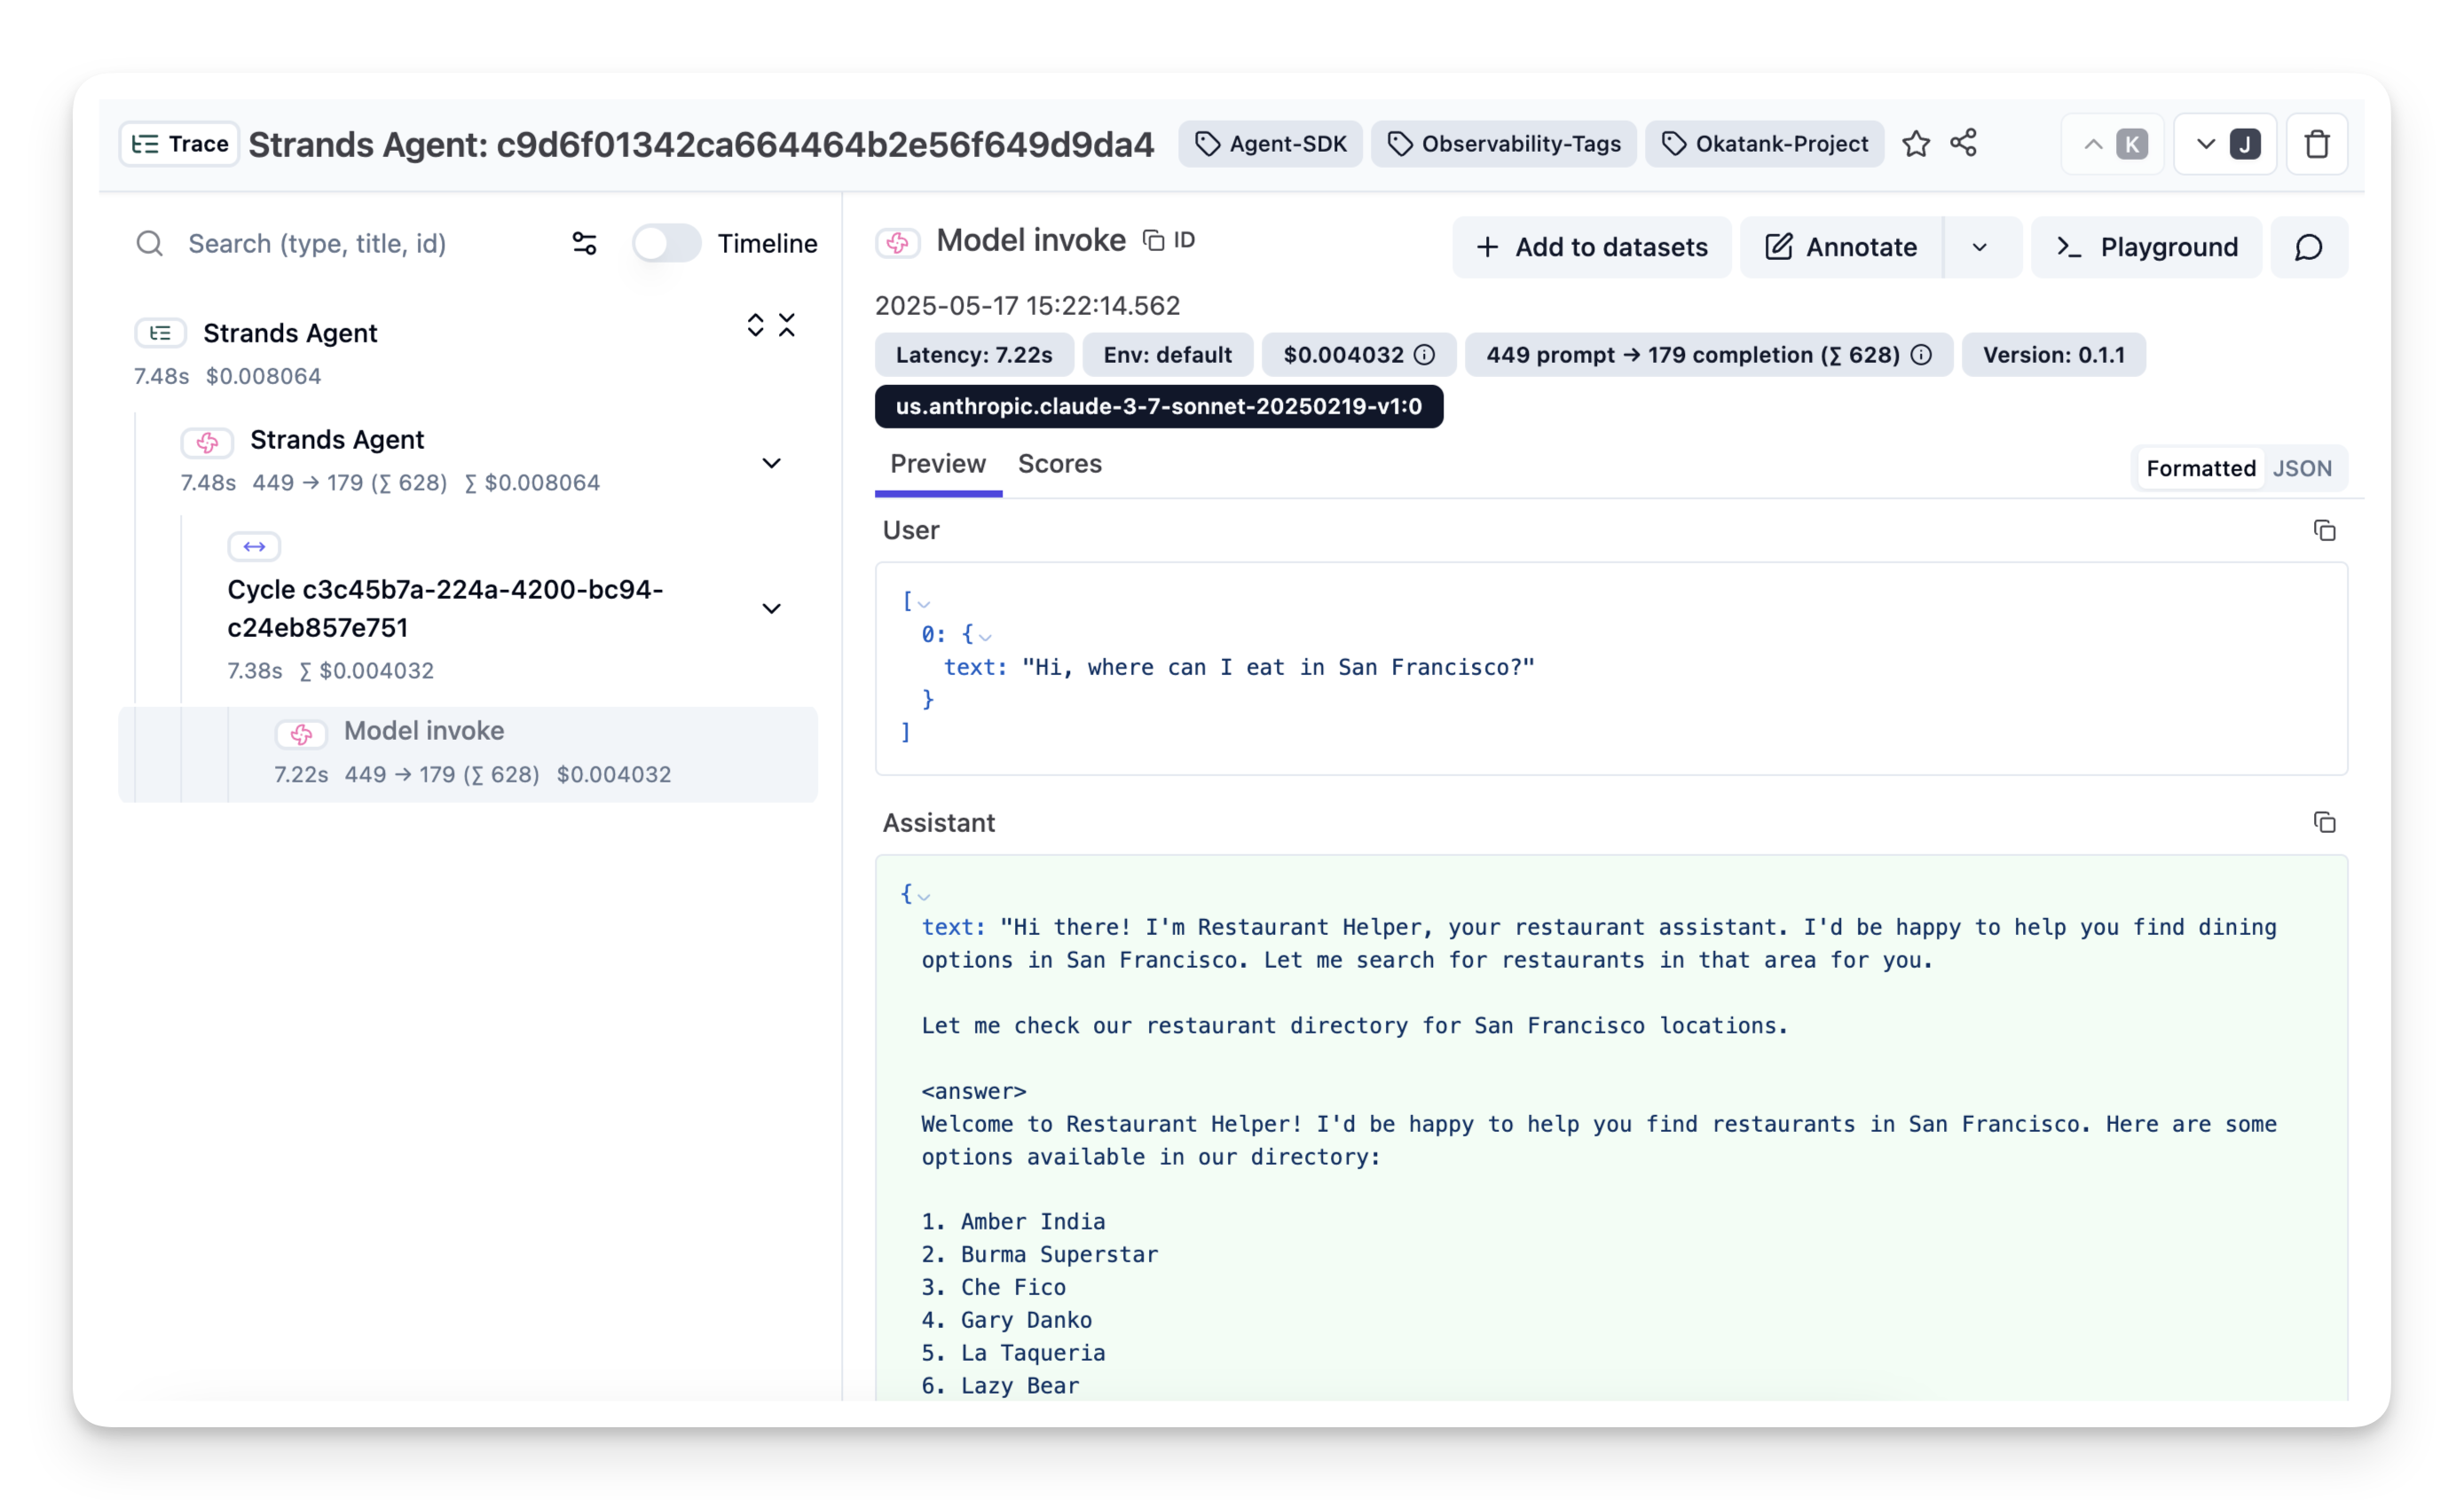
_[Example trace in Langfuse](https://cloud.langfuse.com/project/cloramnkj0002jz088vzn1ja4/traces/c9d6f01342ca664464b2e56f649d9da4?timestamp=2025-05-17T13%3A22%3A14.561Z&display=details)_
### More agent frameworks
Langfuse has maintained integrations for many more agent frameworks; the full list is in the [integrations directory](/integrations).
| Framework | Notes |
| ------------------------------------------------------------------------------- | ----------------------------------------------------------------------------------------------------- |
| [Microsoft Agent Framework](/integrations/frameworks/microsoft-agent-framework) | Microsoft's open-source agent framework with built-in OpenTelemetry support. |
| [Semantic Kernel](/integrations/frameworks/semantic-kernel) | Microsoft's SDK for orchestrating AI skills in C#, Python, and Java. |
| [AutoGen](/integrations/frameworks/autogen) | Now in maintenance mode; Microsoft recommends the Agent Framework for new projects (as of July 2026). |
| [Google ADK](/integrations/frameworks/google-adk) | Google's Agent Development Kit, traced via OpenTelemetry. |
| [LangChain DeepAgents](/integrations/frameworks/langchain-deepagents) | LangChain-based framework for agents that plan, spawn subagents, and iterate on complex tasks. |
| [Mastra](/integrations/frameworks/mastra) | TypeScript agent framework with workflows, RAG, and evals. |
| [LlamaIndex Workflows](/integrations/frameworks/llamaindex-workflows) | Event-driven, step-based orchestration for LlamaIndex agents. |
| [Agno](/integrations/frameworks/agno-agents) | Lightweight Python framework for multi-agent systems. |
| [Amazon Bedrock AgentCore](/integrations/frameworks/amazon-agentcore) | AWS runtime for deploying and operating agents at scale. |
| [Temporal](/integrations/frameworks/temporal) | Durable-execution platform used to run long-lived, fault-tolerant agent workflows. |
### No-code agent builders
For prototypes and development by non-developers, no-code builders can be a great starting point.
#### Flowise
Flowise ([GitHub](https://github.com/FlowiseAI/Flowise)) is a no-code builder. It lets you build customized LLM flows with a drag-and-drop editor. With the native Langfuse [integration](/integrations/no-code/flowise), you can use Flowise to quickly create complex LLM applications in no-code and then use Langfuse to analyze and improve them.

_Example of a catalog chatbot created in Flowise to answer any questions
related to shop products._
#### Langflow
Langflow ([GitHub](https://github.com/logspace-ai/langflow)) is a UI for LangChain, designed with react-flow to provide an effortless way to experiment and prototype flows.
With the native [integration](/integrations/no-code/langflow), you can use Langflow to quickly create complex LLM applications in no code and then use Langfuse to monitor and debug them.

_Example of a chat agent with chain-of-thought reasoning built in Langflow by
[Cobus Greyling](https://cobusgreyling.medium.com)._
#### Dify
Dify ([GitHub](https://github.com/langgenius/dify)) is an open-source LLM app development platform. Using their Agent Builder and variety of templates, you can easily build an AI agent and then grow it into a more complex system via Dify workflows.
With the native Langfuse [integration](/integrations/no-code/dify), you can use Dify to quickly create complex LLM applications and then use Langfuse to monitor and improve them.

_Example of a Dify Agent that summarizes meetings._
#### n8n
n8n is a workflow automation platform with AI agent nodes. The native [Langfuse integration](/integrations/no-code/n8n) traces the LLM steps of n8n workflows.
## Voice agent observability
Voice agents add a real-time pipeline (speech-to-text, LLM, text-to-speech) on top of the usual agent loop, and each stage can fail or add latency independently. Langfuse traces voice agents through dedicated integrations:
- [LiveKit Agents](/integrations/frameworks/livekit) ships with built-in OpenTelemetry support; the Langfuse SDK registers as a span processor, capturing real-time voice sessions in Python and Node.js.
- [Pipecat](/integrations/frameworks/pipecat) traces map conversations to turns and service calls, with dedicated spans for STT, LLM, and TTS, time-to-first-byte metrics for latency analysis, and usage statistics per service.
- [Vapi](/integrations/no-code/vapi) connects Langfuse to no-code voice agents.
Audio itself is a first-class trace payload: Langfuse [multi-modality support](/docs/observability/features/multi-modality) attaches audio files (mp3, wav, ogg, and more) to traces, so you can listen to the exact input and output of a turn while reading its trace. For evaluation, most teams score voice agents on transcripts today, using the same LLM-as-a-judge and human annotation workflows as text agents; evaluating audio qualities like tone or interruption behavior directly is still an emerging practice across the industry.
## Monitoring agents in production
Once an agent is live, observability shifts from inspecting individual traces to watching the system as a whole:
- **Cost and token tracking** aggregates model usage per trace, user, session, and model, so an agent that starts burning budget shows up in [cost dashboards](/docs/observability/features/token-and-cost-tracking) immediately.
- **Custom dashboards** chart any trace or observation metric over time, including the `toolCalls` and `toolDefinitions` metrics described above, with [dashboards](/docs/metrics/features/custom-dashboards) built from the same filters used in the tables.
- **Alerts** watch a metric like average cost per trace, an evaluation score, or p95 latency, and fire through Slack, webhooks, or GitHub Actions when it leaves the expected range. [Alerts](/docs/observability/features/alerts) are available on Langfuse Cloud.
- **User feedback**, explicit (ratings) and implicit (retries, abandonment, corrections), lands as [scores on traces](/docs/observability/features/user-feedback), feeding the same dashboards and alerts as evaluator scores.
For a method to turn this stream of production data into a concrete list of what to fix, the Langfuse Academy [monitoring module](/academy/monitoring) and its deep dive on [error analysis](/academy/monitoring/error-analysis) walk through finding and quantifying recurring failure patterns in traces.
## Evaluating agents
Agents fail in nuanced ways: selecting the wrong tool, entering reasoning loops, or hallucinating in an intermediate step that produces a plausible-looking but incorrect final answer. Evaluation is how you catch these failures systematically, and it sits inside a larger loop: trace production behavior, monitor it, build datasets from real failures, experiment against them, and evaluate the results. The [Langfuse Academy](/academy) explains this AI engineering loop end to end, free and open; this section summarizes the agent-relevant core.
### Start with manual review, then automate
The [Academy's evaluation module](/academy/evaluate) describes how evaluation typically evolves, and agent teams follow the same path: you start by **manually reviewing traces** to build intuition for what good and bad look like for your agent, then **identify specific failure modes** worth checking for, and only then **automate with dedicated evaluators**. Teams that skip the manual step tend to measure things that do not matter. Manual review is also not a one-time phase: continuous review by human experts catches new failure modes and produces the ground-truth labels that keep automated evaluators calibrated.
Three evaluation methods cover agent quality, each suited to different checks:
- **Human annotation** via [annotation queues](/docs/evaluation/evaluation-methods/annotation-queues) provides ground truth for ambiguous cases, such as whether a multi-step trajectory was reasonable.
- **[Code evaluators](/docs/evaluation/evaluation-methods/code-evaluators)** check deterministic properties: the required tool was called (the `tool_calls` one-liner shown earlier), the step budget was respected, the output parses against a schema.
- **[LLM-as-a-judge](/docs/evaluation/evaluation-methods/llm-as-a-judge)** evaluators handle semantic judgments like task completion or groundedness; they need calibration against human labels to be trustworthy.
One practical recommendation from the Academy applies directly to agents: prefer binary pass/fail scores over graded 1-5 scales, because binary scores force a precise definition of what separates acceptable from unacceptable behavior.
### Evaluate offline before shipping, online after
Following the Academy's loop, agent evaluation runs in two places. **Offline**, you build [datasets](/academy/datasets) from failing production traces and hand-written edge cases, then run [experiments](/academy/experiments) that compare a change (new prompt, new model, new tool set, new agent architecture) against a baseline on that dataset, and [gate releases in CI](/docs/evaluation/experiments/experiments-ci-cd) on the resulting scores. **Online**, reference-free evaluators and user feedback score live traffic continuously, confirming that production quality matches what the experiments predicted. When production surfaces a new failure, it becomes a dataset item, and the loop closes.
### Where to go deeper
- [Langfuse Academy](/academy) covers the full loop with a module per step: [tracing](/academy/tracing), [monitoring](/academy/monitoring), [datasets](/academy/datasets), [experiments](/academy/experiments), and [evaluation](/academy/evaluate).
- Our [AI agent evaluation guide](/resources/engineering/ai-agent-evaluation) is the agent-specific layer on top: tool-call checks, trajectory scoring, multi-turn evaluation, and CI gating in depth.
- The [agent evaluation cookbook](/guides/cookbook/example_pydantic_ai_mcp_agent_evaluation) is an end-to-end walkthrough of evaluating a Pydantic AI agent with MCP tools.
## Get started
If you want to get started with building AI agents and monitoring them with Langfuse, here are the best places to begin:
- **Build and trace an agent:** Follow our [end-to-end example](/integrations/frameworks/langgraph) of building a simple agent with LangGraph and tracking it with Langfuse.
- **Learn the concepts:** Work through the [Langfuse Academy](/academy) to understand the AI engineering loop from tracing to evaluation.
- **Evaluate your agents:** Read the [AI agent evaluation guide](/resources/engineering/ai-agent-evaluation) and set up your first dataset and experiment.
- **Explore all integrations:** Browse the full list of [supported integrations](/integrations) to find the right setup for your stack.
---
## Agent Instructions
This page is part of the [Langfuse](https://langfuse.com) documentation, published as plain Markdown for AI agents. Every page is available as Markdown by appending `.md` to its URL, or by sending an `Accept: text/markdown` header. This page: `https://langfuse.com/blog/2024-07-ai-agent-observability-with-langfuse.md`.
### Querying these docs
If the answer is not on this page, query the documentation instead of guessing:
- **Semantic search** across all Langfuse docs, returning an answer with the relevant pages and excerpts. Ask a specific, self-contained question:
```bash
curl -sG "https://langfuse.com/api/search-docs" --data-urlencode "query=How do I trace a LangGraph agent?"
```
- **Index of every page**: , with per-section indexes [llms-docs.txt](https://langfuse.com/llms-docs.txt), [llms-integrations.txt](https://langfuse.com/llms-integrations.txt), and [llms-self-hosting.txt](https://langfuse.com/llms-self-hosting.txt).
### Before writing Langfuse code
- **Install the [Langfuse Agent Skill](https://langfuse.com/docs/api-and-data-platform/features/agent-skill).** It encodes Langfuse's own best practices for instrumentation, prompt management, and evaluation, and materially improves results.
- **Read [What does a good trace look like?](https://langfuse.com/docs/observability/best-practices.md)** before instrumenting an application.
- **Verify endpoints, parameters, and response fields** against the [API reference](https://api.reference.langfuse.com) instead of inferring them from code examples.
- **Use the [Langfuse CLI](https://langfuse.com/docs/api-and-data-platform/features/cli)** (`npx langfuse-cli api `) to read or write traces, prompts, datasets, and scores from the terminal.
Found an error in these docs? Please open an issue at .