---
title: Alerts
sidebarTitle: Alerts
description: Set threshold-based alerts on your LLM application metrics and route notifications through automations when thresholds are breached.
---
# Alerts
**Where is this feature available?**
| Plan | Availability |
| --- | --- |
| Hobby | Available |
| Core | Available |
| Pro | Available |
| Enterprise | Available |
| Self Hosted | Langfuse v4+ |
On Langfuse Cloud, the number of alerts per organization depends on your plan:
**2** (Hobby), **20** (Core), **50** (Pro), and **100** (Enterprise).
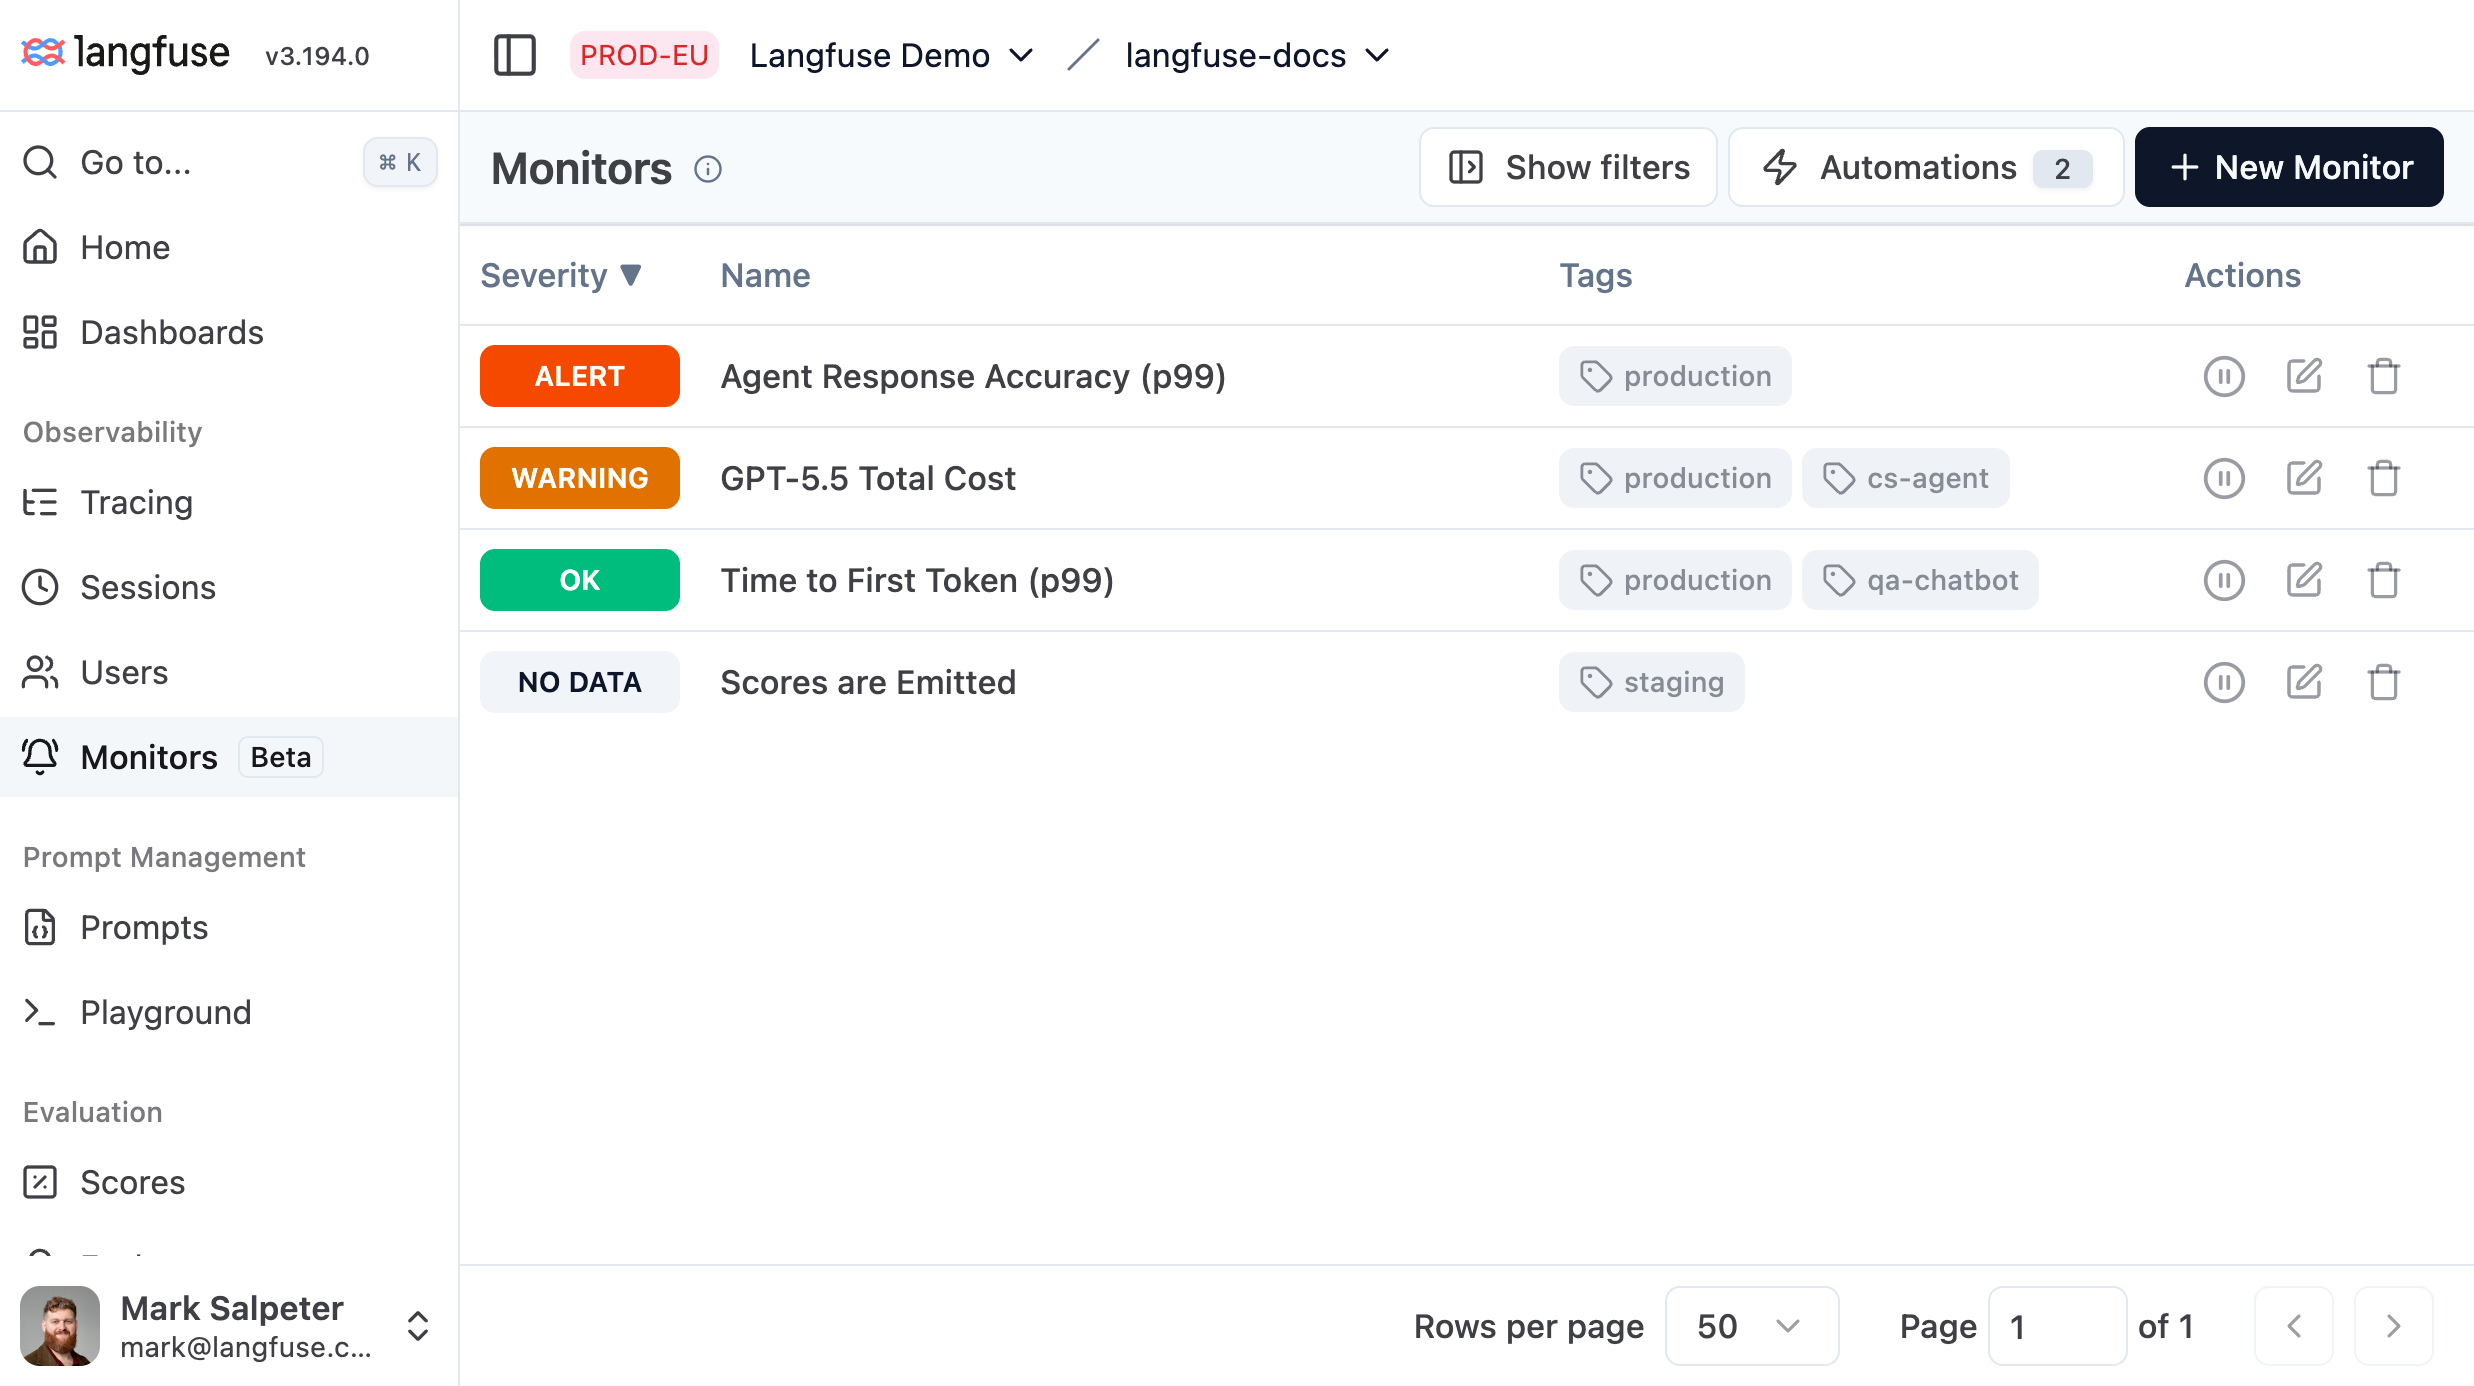
Alerts allow you to catch cost and quality issues before they impact your users.
You can receive notifications over Slack, trigger GitHub Actions, or call your own Webhooks.
## Create an alert [#alert-setup]
Navigate to [**Alerts**](https://cloud.langfuse.com/project/~/monitors) in your project and click **New Alert**.
### Configure the metric
Choose what data the alert measures.
| Field | Description |
| --------------- | --------------------------------------------------------------------------------- |
| **Data source** | `Observations`, `Scores (numeric)`, `Scores (categorical)`, or `Scores (boolean)` |
| **Metric** | Aggregation + measure — e.g. `avg latency`, `count`, `p95 cost` |
| **Filters** | Narrow the dataset (model name, tags, user ID, environment, Boolean value, etc.) |
For Boolean scores, the average value is the share of scores that are `true`. Use it to alert on rates such as policy-check passes or detected hallucinations.
### Set alert conditions
Choose what range you expect the metric values to fall within.
| Field | Description |
| --------------------- | ---------------------------------------------------------------------------------------- |
| **Operator** | `>`, `≥`, `<`, `≤`, `=`, `≠` — direction of the alert condition |
| **Alert threshold** | Required. Crossing this value sets severity to **ALERT**. |
| **Warning threshold** | Optional. Crossing this value (before the alert threshold) sets severity to **WARNING**. |
| **Window** | How far back each evaluation looks (e.g. `1 hour`, `1 day`, `1 week`) |
### Configure advanced settings (optional)
Choose special handling for edge cases when data is missing or when an alert stays in an unresolved state for extended periods of time.
**No-data handling** — what happens when the query returns no data:
| Mode | Behavior |
| ------------------------------------- | ------------------------------------------------------------------------- |
| **Treat missing data as 0** (default) | Treat null as `0` and compare against thresholds |
| **Keep the previous severity** | Hold the previous severity; send no notification |
| **Show severity NO_DATA** | Record `NO_DATA` severity; send no notification |
| **Notify after sustained NO_DATA** | Record `NO_DATA` severity; send a notification after a configurable delay |
**Renotify** — whether to re-notify while severity stays elevated:
| Mode | Behavior |
| ----------------- | ------------------------------------------------------------------ |
| `Off` (default) | Notifies once on each severity transition |
| `Every N minutes` | Re-notifies every N minutes while severity persists (1–10,080 min) |
### Select a notification channel [#notification-channel]
Select one or more automations from the **Automations** panel. When an alert fires, Langfuse publishes the event to each selected automation, which dispatches your configured actions (Slack message, webhook, etc.).
See [Automations](#automations) to set up actions before linking them here.
### Name and save
Give the alert a descriptive name (max 200 characters) and optional tags, then click **Save**. You can also leave the title blank to generate one from the alert configuration. The alert becomes **ACTIVE** immediately and schedules its first evaluation.
## Alert states [#alert-states]
Each alert carries a **severity** that updates after every evaluation.
| Severity | Meaning |
| --------- | ---------------------------------------------------------------------------------------------------------- |
| `UNKNOWN` | Initial state — not yet evaluated |
| `OK` | Metric is within bounds |
| `WARNING` | Metric crossed the warning threshold |
| `ALERT` | Metric crossed the alert threshold |
| `NO_DATA` | Query returned no data and no-data mode is **Show severity NO_DATA** or **Notify after sustained NO_DATA** |
| `PAUSED` | Alert is paused; no evaluations run |
**When notifications fire:**
- Breach (`UNKNOWN | OK → WARNING | ALERT`): always notifies.
- Recovery (`WARNING | ALERT → OK`): always notifies.
- No data (`NO_DATA ↔ WARNING | ALERT | OK | UNKNOWN`): only notifies when no-data mode is **Notify after sustained `NO_DATA`**.
- Sustained severity (`WARNING → WARNING`, `ALERT → ALERT`): notifies only when **Renotify** is enabled.
## Pause, resume, or delete an alert [#pause]
From the alert list or detail page, use the row actions menu to **Pause** or **Resume** an alert. A paused alert skips all evaluations; its severity is frozen at `PAUSED`. Resuming sets it back to `ACTIVE` and schedules the next evaluation.
To permanently remove an alert, open its detail page, click the trash icon, and confirm **Delete alert**. This action cannot be undone.
## Automations [#automations]
Automations route alert notifications to external systems. Each automation pairs a **trigger** (an alert severity change) with an **action** (a notification sent to an external system).
Three notification channels are available:
| Action | What it does |
| ------------------ | ----------------------------------------------------------- |
| **Slack** | Posts a formatted alert message to a Slack channel |
| **Webhook** | HTTP POST to your endpoint with an HMAC-signed JSON payload |
| **GitHub Actions** | Fires a `workflow_dispatch` event on a GitHub repository |
If you would like to see another channel added, please add to the [GitHub discussions](#gh-discussion).
### Create an alert automation [#automation-setup]
1. Navigate to [**Automations**](https://cloud.langfuse.com/project/~/automations) and click **Create Automation**.
2. Select event source **Alert**.
3. Select an action type (**Slack**, **Webhook**, or **GitHub Actions**).
4. Configure the action: provide a Slack channel, a webhook endpoint URL, or a GitHub repository dispatch URL, event type, and personal access token.
5. Give the automation a name and click **Save**. It will appear in the [**Automations** panel](#notification-channel) when you create or edit alerts.
### Link an alert to an automation
1. [Create a new alert automation](#automation-setup) or edit an existing one.
2. [Create a new alert](#alert-setup) or edit an existing one.
3. Select the automation from the [**Automations** panel](#notification-channel) found in the **notifications section** of the alert editor.
4. Click **Save** to link the alert to the selected automations.
An alert fires every linked automation whenever its severity transitions (see [Alert states](#alert-states)).
After **5 consecutive delivery failures**, Langfuse automatically disables the
automation's trigger. Re-enable it from the Automations page once the endpoint
is restored.
### Webhook payload [#automations-webhook-payload]
Your endpoint receives a signed JSON body:
```json filename="alert-payload.json"
{
"id": "550e8400-e29b-41d4-a716-446655440000",
"timestamp": "2024-07-10T10:30:00Z",
"type": "monitor-alert",
"apiVersion": "v1",
"payload": {
"monitorId": "monitor_abc123",
"projectId": "proj_xyz789",
"permalink": "https://cloud.langfuse.com/project/proj_xyz789/monitors/monitor_abc123",
"message": {
"title": "avg latency crossed alert threshold",
"body": "avg latency is 1234 ms (threshold: 1000 ms) over the last 1 hour"
},
"severity": "ALERT",
"timestamp": "2024-07-10T10:30:00Z",
"fromTimestamp": "2024-07-10T09:30:00Z",
"toTimestamp": "2024-07-10T10:30:00Z",
"view": "observations",
"filters": [],
"window": "1h"
}
}
```
The payload keeps the legacy `monitor` naming (`type`, `monitorId`,
`permalink`) so existing integrations continue to work unchanged.
Signature verification works identically to prompt webhooks — see [Webhooks](/docs/prompt-management/features/webhooks-slack-integrations) for the HMAC validation code.
## Create alerts from evaluators [#evaluator-alerts]
Create score and cost alerts directly from evaluator pages. Langfuse prefills the metric and filters, excludes evaluator test runs, and shows alerts already connected to the evaluator.
See [Monitor evaluator results](/docs/evaluation/core-concepts#monitor-evaluator-results) for supported alert types, defaults, and the evaluator workflow.
## GitHub Discussions [#gh-discussion]
---
## Agent Instructions
This page is part of the [Langfuse](https://langfuse.com) documentation, published as plain Markdown for AI agents. Every page is available as Markdown by appending `.md` to its URL, or by sending an `Accept: text/markdown` header. This page: `https://langfuse.com/docs/observability/features/alerts.md`.
### Querying these docs
If the answer is not on this page, query the documentation instead of guessing:
- **Semantic search** across all Langfuse docs, returning an answer with the relevant pages and excerpts. Ask a specific, self-contained question:
```bash
curl -sG "https://langfuse.com/api/search-docs" --data-urlencode "query=How do I trace a LangGraph agent?"
```
- **Index of every page**: , with per-section indexes [llms-docs.txt](https://langfuse.com/llms-docs.txt), [llms-integrations.txt](https://langfuse.com/llms-integrations.txt), and [llms-self-hosting.txt](https://langfuse.com/llms-self-hosting.txt).
### Before writing Langfuse code
- **Install the [Langfuse Agent Skill](https://langfuse.com/docs/api-and-data-platform/features/agent-skill).** It encodes Langfuse's own best practices for instrumentation, prompt management, and evaluation, and materially improves results.
- **Read [What does a good trace look like?](https://langfuse.com/docs/observability/best-practices.md)** before instrumenting an application.
- **Verify endpoints, parameters, and response fields** against the [API reference](https://api.reference.langfuse.com) instead of inferring them from code examples.
- **Use the [Langfuse CLI](https://langfuse.com/docs/api-and-data-platform/features/cli)** (`npx langfuse-cli api `) to read or write traces, prompts, datasets, and scores from the terminal.
Found an error in these docs? Please open an issue at .