---
source: ⚠️ Jupyter Notebook
title: Monitor Parallel Tasks with Langfuse
sidebarTitle: Parallel
logo: /images/integrations/parallel_icon.svg
logoAppearance: dark
description: Learn how to trace Parallel task execution using Langfuse to capture detailed observability data for your AI workflow operations.
category: Integrations
---
# Parallel Integration
In this guide, we'll show you how to integrate [Langfuse](https://langfuse.com) with [Parallel](https://parallel.ai/) to trace your AI task operations. By leveraging Langfuse's tracing capabilities, you can automatically capture details such as inputs, outputs, and execution times of your Parallel tasks.
> **What is Parallel?** [Parallel](https://parallel.ai/) develops a suite of web search and web agent APIs that connect AI agents, applications, and workflows to the open internet, enabling programmable tasks from simple searches to complex knowledge work.
> **What is Langfuse?** [Langfuse](https://langfuse.com) is an open source AI engineering platform that helps teams trace API calls, monitor performance, and debug issues in their LLM applications.
## Get Started
First, install the necessary Python packages:
```python
%pip install langfuse parallel-web openai
```
Next, configure your environment with your Parallel and Langfuse API keys. You can get these keys by signing up for a free [Langfuse Cloud](https://langfuse.com/cloud) account or by [self-hosting Langfuse](https://langfuse.com/self-hosting) and from the [Parallel dashboard](https://parallel.ai/).
```python
import os
# Get keys for your project from the project settings page: https://cloud.langfuse.com
os.environ.setdefault("LANGFUSE_PUBLIC_KEY", "pk-lf-...");
os.environ.setdefault("LANGFUSE_SECRET_KEY", "sk-lf-...");
os.environ.setdefault("LANGFUSE_BASE_URL", "https://cloud.langfuse.com"); # 🇪🇺 EU region
# Other Langfuse data regions include 🇺🇸 US: https://us.cloud.langfuse.com, 🇯🇵 Japan: https://jp.cloud.langfuse.com and ⚕️ HIPAA: https://hipaa.cloud.langfuse.com
# Your Parallel key
os.environ.setdefault("PARALLEL_API_KEY", "...");
# Your openai key
os.environ.setdefault("OPENAI_API_KEY", "sk-proj-...");
```
## Example 1: Tracing the Parallel Task API
To monitor the Task API requests, we use the [Langfuse `@observe()` decorator](https://langfuse.com/docs/sdk/python/decorators). In this example, the `@observe()` decorator captures the inputs, outputs, and execution time of the `parallel_task()` function. For more control over the data you are sending to Langfuse, you can use the [Context Manager or create manual observations](https://langfuse.com/docs/observability/sdk/python/instrumentation#custom-instrumentation) using the Python SDK.
```python
import os
from parallel import Parallel
from parallel.types import TaskSpecParam
from langfuse import observe
client = Parallel(api_key=os.environ["PARALLEL_API_KEY"])
@observe(as_type="retriever")
def parallel_task(input: str):
task_run = client.task_run.create(
input=input,
task_spec=TaskSpecParam(
output_schema="The founding date of the company in the format MM-YYYY"
),
processor="base"
)
print(f"Run ID: {task_run.run_id}")
run_result = client.task_run.result(task_run.run_id, api_timeout=3600)
print(run_result.output)
return run_result.output
parallel_task("Langfuse")
```
## Example 2: Tracing the Parallel Chat API
You can trace the interactions with the Parallel Chat API by using the [Langfuse OpenAI wrapper](https://langfuse.com/integrations/model-providers/openai-py):
```python
from langfuse.openai import OpenAI
client = OpenAI(
api_key=os.environ["PARALLEL_API_KEY"], # Your Parallel API key
base_url="https://api.parallel.ai" # Parallel's API beta endpoint
)
response = client.chat.completions.create(
model="speed", # Parallel model name
name="Parallel Chat",
messages=[
{"role": "user", "content": "What does Parallel Web Systems do?"}
],
response_format={
"type": "json_schema",
"json_schema": {
"name": "reasoning_schema",
"schema": {
"type": "object",
"properties": {
"reasoning": {
"type": "string",
"description": "Think step by step to arrive at the answer",
},
"answer": {
"type": "string",
"description": "The direct answer to the question",
},
"citations": {
"type": "array",
"items": {"type": "string"},
"description": "Sources cited to support the answer",
},
},
},
},
},
)
print(response.choices[0].message.content)
```
## Example 3: Parallel Search API and OpenAI
You can also trace more complex workflows that involve summarizing the search results with OpenAI. Here we use the [Langfuse `@observe()` decorator](https://langfuse.com/docs/sdk/python/decorators) to group both the Parallel search and the OpenAI generation into one trace.
```python
import os
from parallel import Parallel
from langfuse.openai import OpenAI
from langfuse import observe
@observe()
def search_and_summarize(objective, search_queries):
# 1. Parallel Search API
parallel_client = Parallel(api_key=os.environ["PARALLEL_API_KEY"])
@observe(as_type="retriever")
def search_with_parallel(objective, search_queries, num_results: int = 5):
"""Search the web using Parallel and return results."""
search = parallel_client.beta.search(
objective=objective,
search_queries=search_queries,
processor="base",
max_results=num_results,
max_chars_per_result=6000
)
return search.results
results = search_with_parallel(objective, search_queries)
results_text = "\n\n".join(str(r) for r in results) if results else "No results."
# 2. Summarize with OpenAI
openai_client = OpenAI()
resp = openai_client.chat.completions.create(
model="gpt-5-mini",
messages=[
{"role": "system", "content": "Summarize the following search results clearly and concisely."},
{"role": "user", "content": results_text}
]
)
return resp.choices[0].message.content
# Example usage
search_and_summarize(
objective="Explain what Langfuse is and highlight its main features for LLM application observability.",
search_queries=[
"Langfuse LLM observability",
"Langfuse features and documentation",
"Langfuse tracing evaluations dashboards"
],
)
```
## See Traces in Langfuse
After executing the traced functions, log in to your [Langfuse Dashboard](https://cloud.langfuse.com) to view detailed trace logs. You'll be able to see:
- Individual task creation and retrieval operations
- Parallel execution patterns and timing
- Input prompts and output results
- Performance metrics for each task
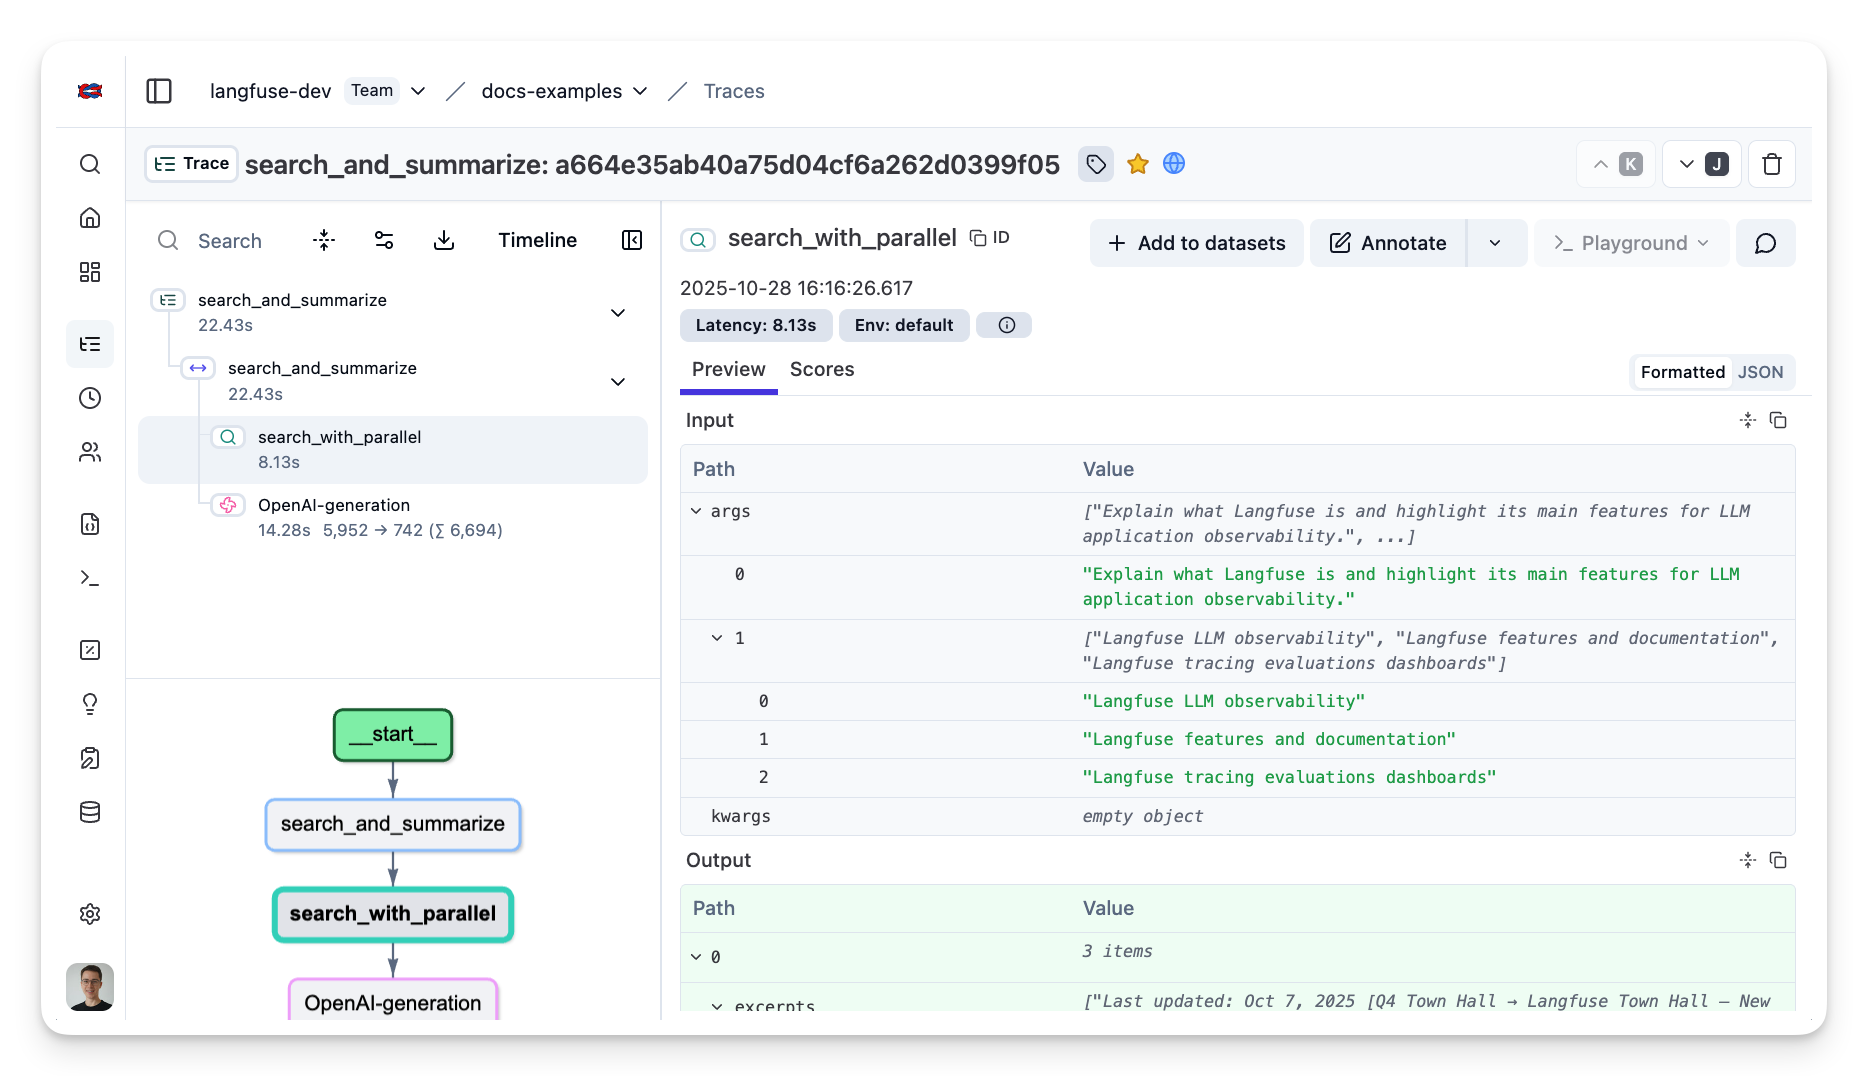
[Example trace in Langfuse](https://cloud.langfuse.com/project/cloramnkj0002jz088vzn1ja4/traces/a664e35ab40a75d04cf6a262d0399f05?timestamp=2025-10-28T15%3A16%3A26.617Z&observation=13fc56583aafeb06)
## Interoperability with the Python SDK
You can use this integration together with the Langfuse [SDKs](/docs/observability/sdk/overview) to add additional attributes to the observation.
The [`@observe()` decorator](/docs/observability/sdk/instrumentation#custom-instrumentation) provides a convenient way to automatically wrap your instrumented code and add additional attributes to the observation.
```python
from langfuse import observe, propagate_attributes, get_client
langfuse = get_client()
@observe()
def my_llm_pipeline(input):
# Add additional attributes (user_id, session_id, metadata, version, tags) to all spans created within this execution scope
with propagate_attributes(
user_id="user_123",
session_id="session_abc",
tags=["agent", "my-observation"],
metadata={"email": "user@langfuse.com"},
version="1.0.0"
):
# YOUR APPLICATION CODE HERE
result = call_llm(input)
return result
# Run the function
my_llm_pipeline("Hi")
```
Learn more about using the Decorator in the [Langfuse SDK instrumentation docs](/docs/observability/sdk/instrumentation#custom-instrumentation).
The [Context Manager](/docs/observability/sdk/instrumentation#custom-instrumentation) allows you to wrap your instrumented code using context managers (with `with` statements), which allows you to add additional attributes to the observation.
```python
from langfuse import get_client, propagate_attributes
langfuse = get_client()
with langfuse.start_as_current_observation(
as_type="span",
name="my-observation",
trace_context={"trace_id": "abcdef1234567890abcdef1234567890"}, # Must be 32 hex chars
) as observation:
# Add additional attributes (user_id, session_id, metadata, version, tags)
# to all observations created within this execution scope
with propagate_attributes(
user_id="user_123",
session_id="session_abc",
metadata={"experiment": "variant_a", "env": "prod"},
version="1.0",
):
# YOUR APPLICATION CODE HERE
result = call_llm("some input")
# Flush events in short-lived applications
langfuse.flush()
```
Learn more about using the Context Manager in the [Langfuse SDK instrumentation docs](/docs/observability/sdk/instrumentation#custom-instrumentation).
## Troubleshooting
No observations appearing
First, enable [debug mode](/docs/observability/sdk/advanced-features#logging--debugging) in the Python SDK:
```bash
export LANGFUSE_DEBUG="True"
```
Then run your application and check the debug logs:
- **OTel observations appear in the logs:** Your application is instrumented correctly but observations are not reaching Langfuse. To resolve this:
1. Call [`langfuse.flush()`](/docs/observability/sdk/instrumentation#client-lifecycle--flushing) at the end of your application to ensure all observations are exported.
2. Verify that you are using the correct API keys and base URL.
- **No OTel spans in the logs:** Your application is not instrumented correctly. Make sure the instrumentation runs before your application code.
Unwanted observations in Langfuse
The Langfuse SDK is based on OpenTelemetry. Other libraries in your application may emit OTel spans that are not relevant to you. These still count toward your [billable units](/docs/administration/billable-units), so you should filter them out. See [Unwanted spans in Langfuse](/faq/all/unwanted-http-database-spans) for details.
Missing attributes
Some attributes may be stored in the metadata object of the observation rather than being mapped to the Langfuse data model. If a mapping or integration does not work as expected, please [raise an issue on GitHub](/issues).
## Next Steps
Once you have instrumented your code, you can manage, evaluate and debug your application:
- [Manage prompts in Langfuse](/docs/prompts/get-started)
- [Add evaluation scores](/docs/evaluation/features/evaluation-methods/custom-scores)
- [Run LLM-as-a-judge Evaluators](/docs/scores/model-based-evals)
- [Create datasets](/docs/datasets/overview)
- [Create custom dashboards](/docs/analytics/custom-dashboards)
- [Test queries in the Playground](/docs/playground)
---
## Agent Instructions
This page is part of the [Langfuse](https://langfuse.com) documentation, published as plain Markdown for AI agents. Every page is available as Markdown by appending `.md` to its URL, or by sending an `Accept: text/markdown` header. This page: `https://langfuse.com/integrations/other/parallel-ai.md`.
### Querying these docs
If the answer is not on this page, query the documentation instead of guessing:
- **Semantic search** across all Langfuse docs, returning an answer with the relevant pages and excerpts. Ask a specific, self-contained question:
```bash
curl -sG "https://langfuse.com/api/search-docs" --data-urlencode "query=How do I trace a LangGraph agent?"
```
- **Index of every page**: , with per-section indexes [llms-docs.txt](https://langfuse.com/llms-docs.txt), [llms-integrations.txt](https://langfuse.com/llms-integrations.txt), and [llms-self-hosting.txt](https://langfuse.com/llms-self-hosting.txt).
### Before writing Langfuse code
- **Install the [Langfuse Agent Skill](https://langfuse.com/docs/api-and-data-platform/features/agent-skill).** It encodes Langfuse's own best practices for instrumentation, prompt management, and evaluation, and materially improves results.
- **Read [What does a good trace look like?](https://langfuse.com/docs/observability/best-practices.md)** before instrumenting an application.
- **Verify endpoints, parameters, and response fields** against the [API reference](https://api.reference.langfuse.com) instead of inferring them from code examples.
- **Use the [Langfuse CLI](https://langfuse.com/docs/api-and-data-platform/features/cli)** (`npx langfuse-cli api `) to read or write traces, prompts, datasets, and scores from the terminal.
Found an error in these docs? Please open an issue at .