Langfuse for Agents
Trace agents with beautifully rendered tool calls and understand their performance through Agent Evals.
Our users increasingly trace agentic applications in Langfuse, so we want to make Langfuse better for understanding agents.
What's New
Agent Tools
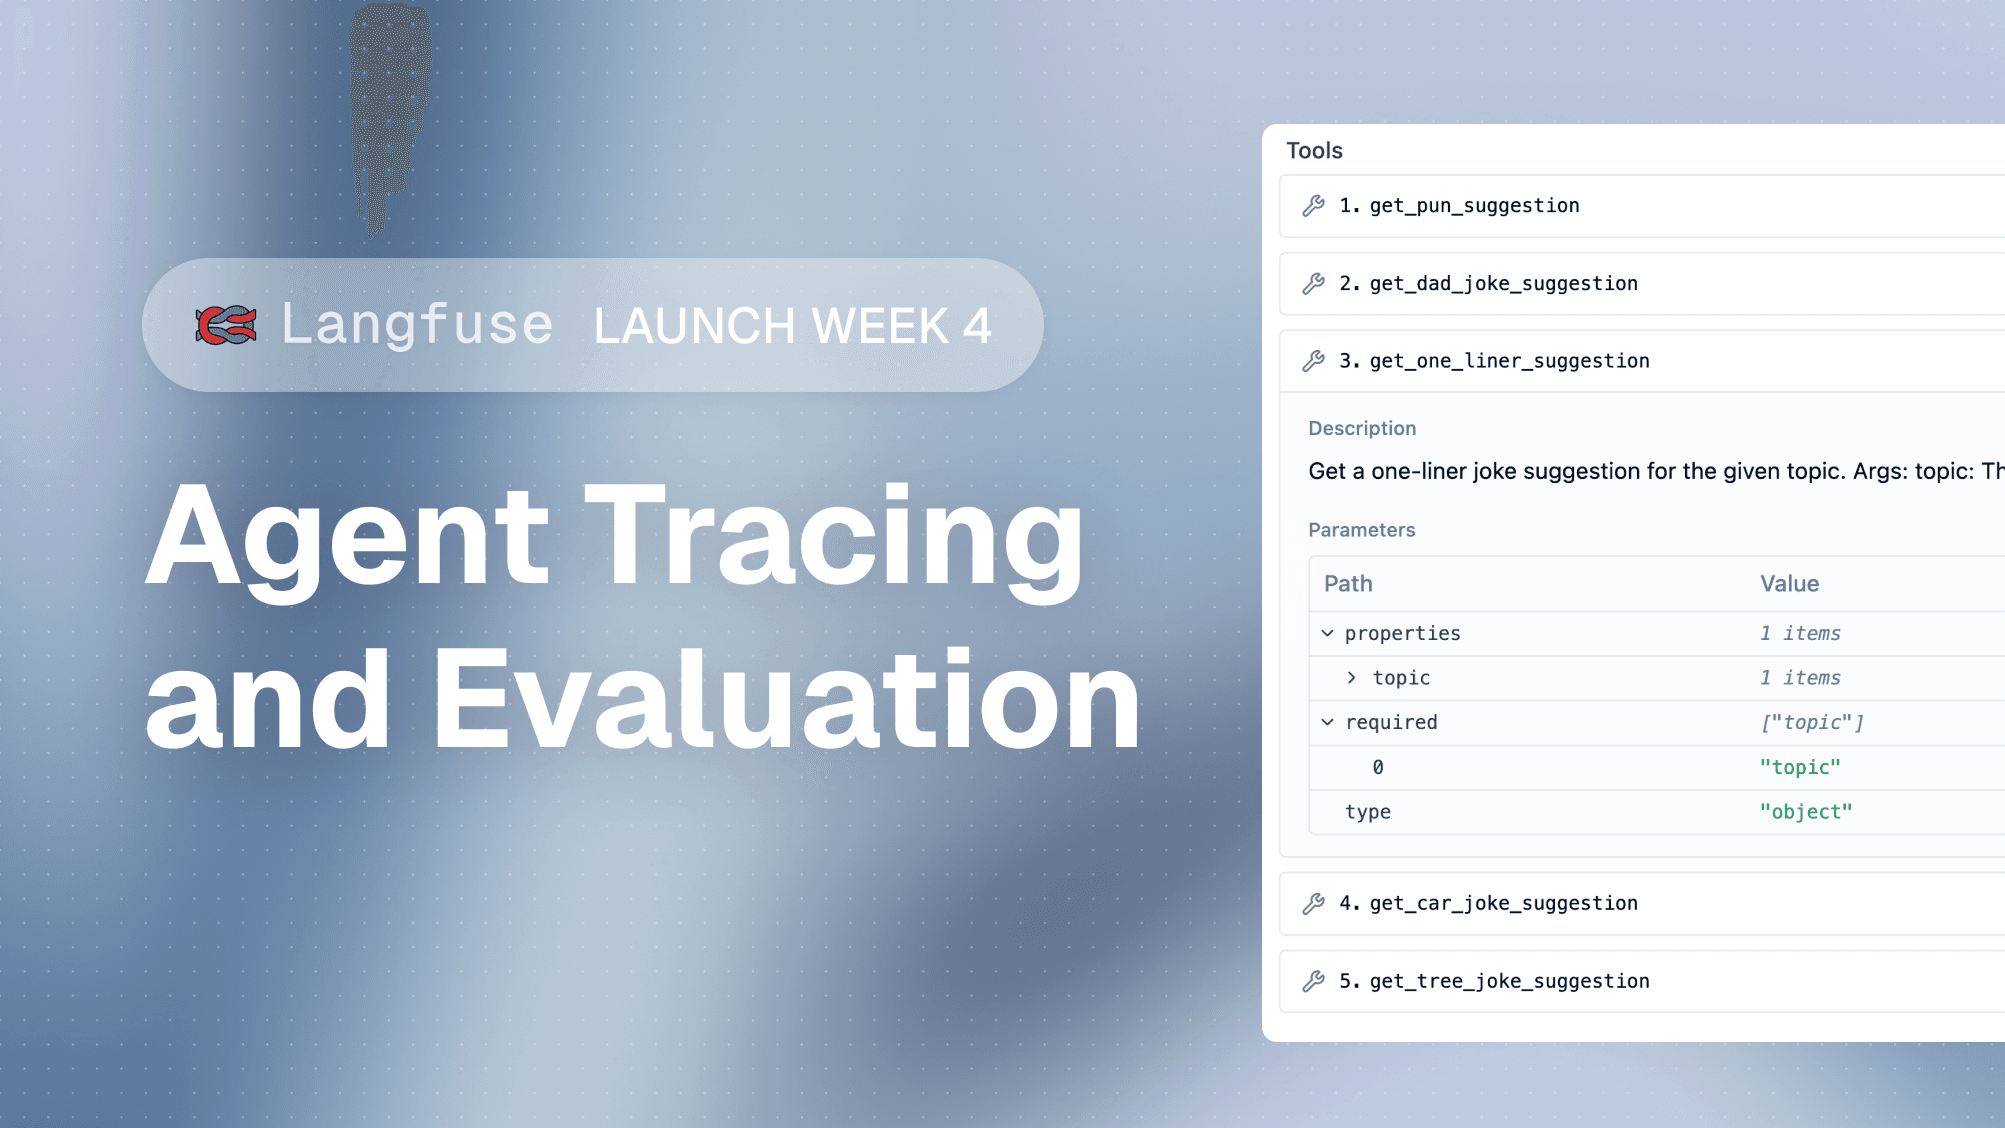
Tool calls are the heartbeat of agents. We now render all tools available to an LLM at the top of each generation, allowing you to instantly see if the LLM selected the right one. You can click on any tool to reveal its full definition, description, and parameters. In the Chat UI, we also now display called tools alongside their arguments and call IDs. The numbering matches the available tools list, making it easy to validate performed calls against available options.

Trace Log View
We're rolling out a new Log View for traces—a single concatenation of all data in a trace's observations. You can now skim every agent step just by scrolling. This view also makes it simple to CMD/Ctrl+F through an entire trace. This is a superpower when you need to find specific details inside very loopy, verbose agents.

Observation Types
We’ve expanded the supported observation types to bring more meaning to your spans. Now, you can easily identify the type of action an observation represents, such as tool calls, embeddings or agents.

Agent Graphs GA
Agent graphs are now Generally Available and works with any agent framework or custom instrumentation. We infer the graph structure from observation timings and nesting to visualize the true flow of your agent's execution, especially useful for navigating complex looping observations.
