Systematic Evaluation of AI Agents
A practical guide to running and interpreting experiments in Langfuse.
AI systems are stochastic. Traditional deterministic software tests are insufficient for validating non-deterministic outputs. Every prompt tweak, model swap, or config change is an experiment. The performance of each experiment must be quantified to drive improvements and prevent regressions in production. Next to request duration, evaluation metrics such as accuracy or quality often provide crucial insight. These sometimes qualitative metrics are, however, notoriously difficult to quantify reliably at scale.
Langfuse experiments solve this by producing performance snapshots of an application, measuring output quality, cost, and latency.
This guide describes a process to systematically evaluate and iterate on the quality of an application. We will explain:
- How to run experiments?
- How to interpret experiment results?
Generally, it helps to think of running experiments as a CI pipeline for model quality. Interpretation of experiment results is the debugging phase. It requires a systematic comparison against a baseline to confirm quality improved while cost and latency remained acceptable.
Before diving into these sections, let’s assume an AI application is using sonnet-4 (the baseline) in production. The goal is to decide if sonnet-4.5 (the candidate) is a clear improvement. An experiment is run using sonnet-4.5.
We’ll demonstrate running experiments via the Langfuse SDK. For other experiment execution methods please refer to docs.
Run experiment
Running the experiment involves three components: the task, the data, and the evaluators.
1. Task
The task is the target function being tested. This is typically the AI application, a specific chain, or , more generally speaking, any function that accepts an input and returns an output. Given our example, we’d change our task definition to use sonnet-4.5.
2. Data
The data provides the inputs for the task. This can be a simple local list of test cases or, more commonly, a dataset managed in Langfuse. Datasets provide a stable set of test cases —so called dataset items— to run against different versions of the task. Optionally items track expected output for each single item.
3. Evaluators
Evaluators score the quality of the task’s output for a single item. They receive the input, output, and optional expected output, and produce scores (e.g., relevance, correctness). Often if expected output is provided evaluators compare actual and expected output. Diving deeper into evals is recommended [link].
Managed Execution
Our experiment framework abstracts the execution logic. It automatically handles:
- Concurrent execution: Tasks are run in parallel with configurable limits to manage load.
- Error isolation: Failures in a single task or evaluator do not terminate the entire experiment run.
- Automatic tracing: All executions, outputs, metadata, and evaluation scores are automatically traced and ingested by Langfuse for detailed observability. Resulting data is flagged under
experimentenvironment to separate experiment data from prod observability data.
This architecture separates the core application logic (the task) from the evaluation logic (the evaluators) and the test cases (the data), allowing for systematic, repeatable testing. Advanced configurations for CI integration or asynchronous tasks are also supported [link].
from langfuse import Evaluation

# 1.TASK: Define your task function
def my_task(*, item, **kwargs):
    question = item["input"]
    response = Anthropic().messages.create(
        model="sonnet-4.5", messages=[{"role": "user", "content": question}]
    )

    return response.choices[0].message.content

# 2.DATA: Get dataset from Langfuse
dataset = langfuse.get_dataset("my-evaluation-dataset")

# 3.EVALUATORS: Define evaluation functions
def accuracy_evaluator(*, input, output, expected_output, metadata, **kwargs):
    if expected_output and expected_output.lower() in output.lower():
        return Evaluation(name="accuracy", value=1.0, comment="Correct answer found")

    return Evaluation(name="accuracy", value=0.0, comment="Incorrect answer")

# Run experiment directly on the dataset
result = dataset.run_experiment(
    name="Production Model Test",
    description="Monthly evaluation of our production model",
    task=my_task,
    evaluators=[accuracy_evaluator]
)

# Use format method to display results
print(result.format())
Interpret experiments results
As we have successfully run our experiment, interpretation follows a top-down funnel:
1. The Macro View (All Experiments)
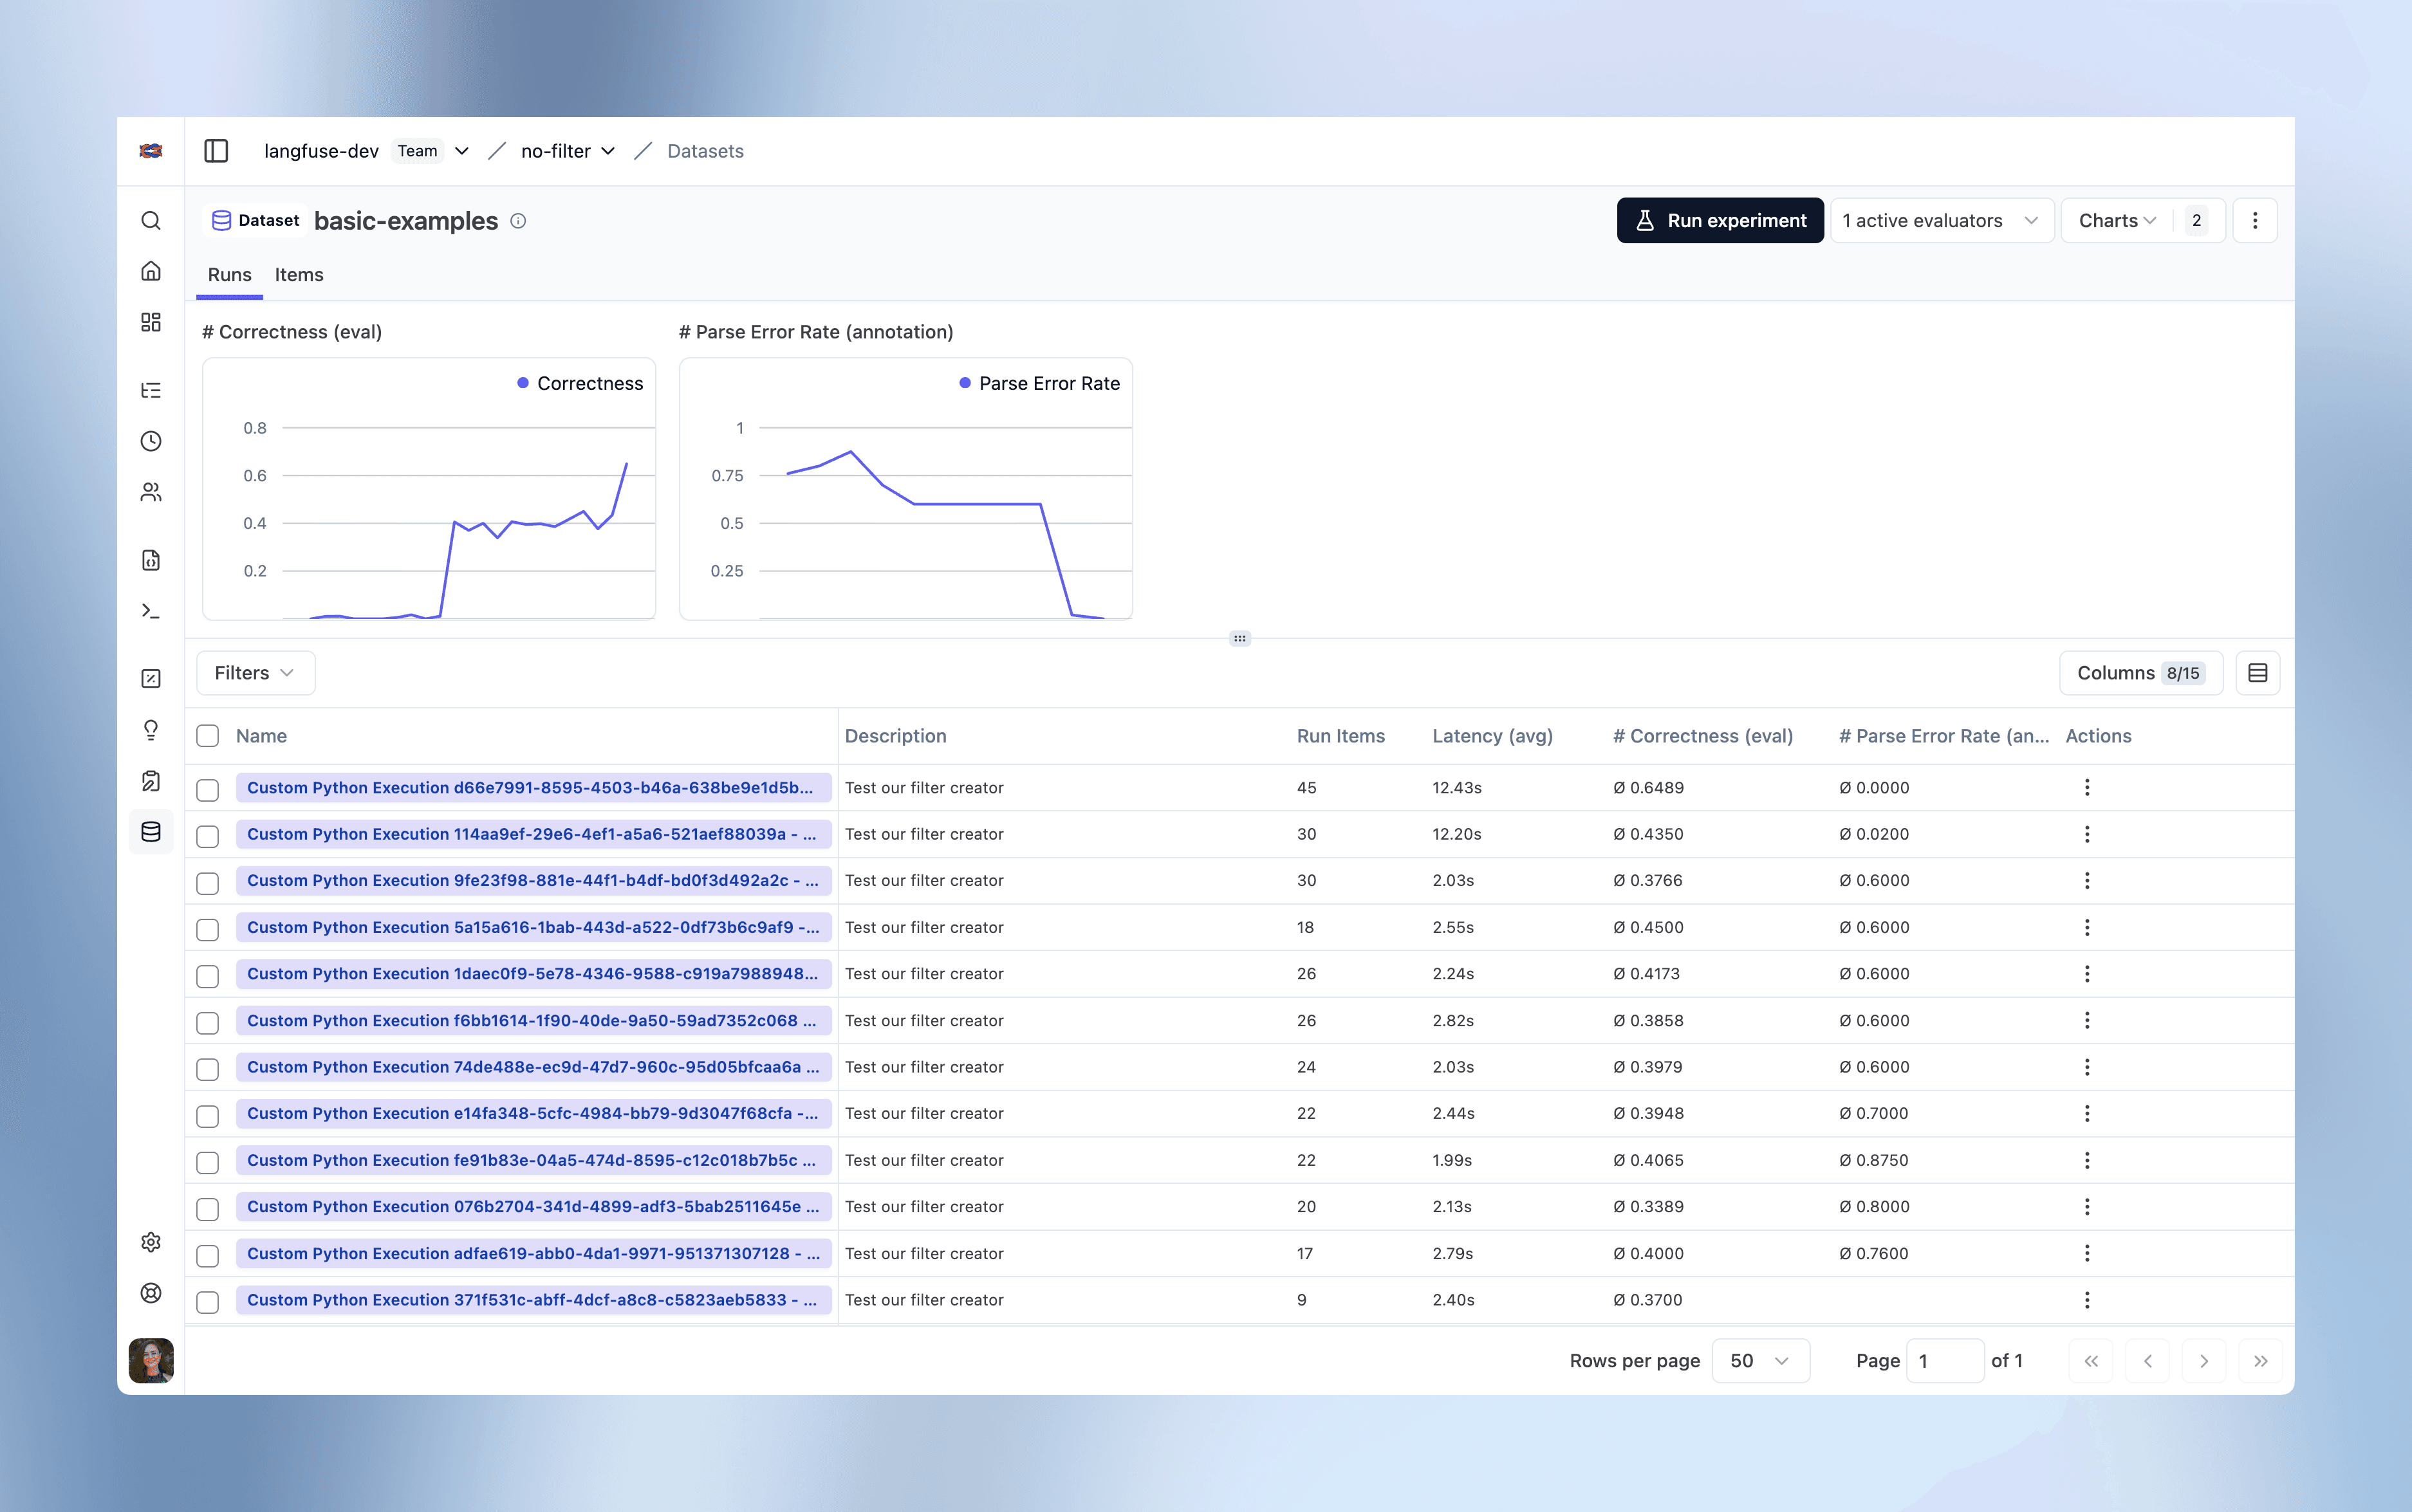
First, review the experiments table. It tracks high-level metrics (avg. score, cost, latency) across all experiments for a given dataset. This view shows which experiments are potential improvements or clear regressions at a glance. Note that while some users will rely on score averages/counts to model the latter, some more sophisticated users ingest experiment-level scores such as Pass/Fail, F1, precision.

2. The Baseline Comparison (The “Diff”)
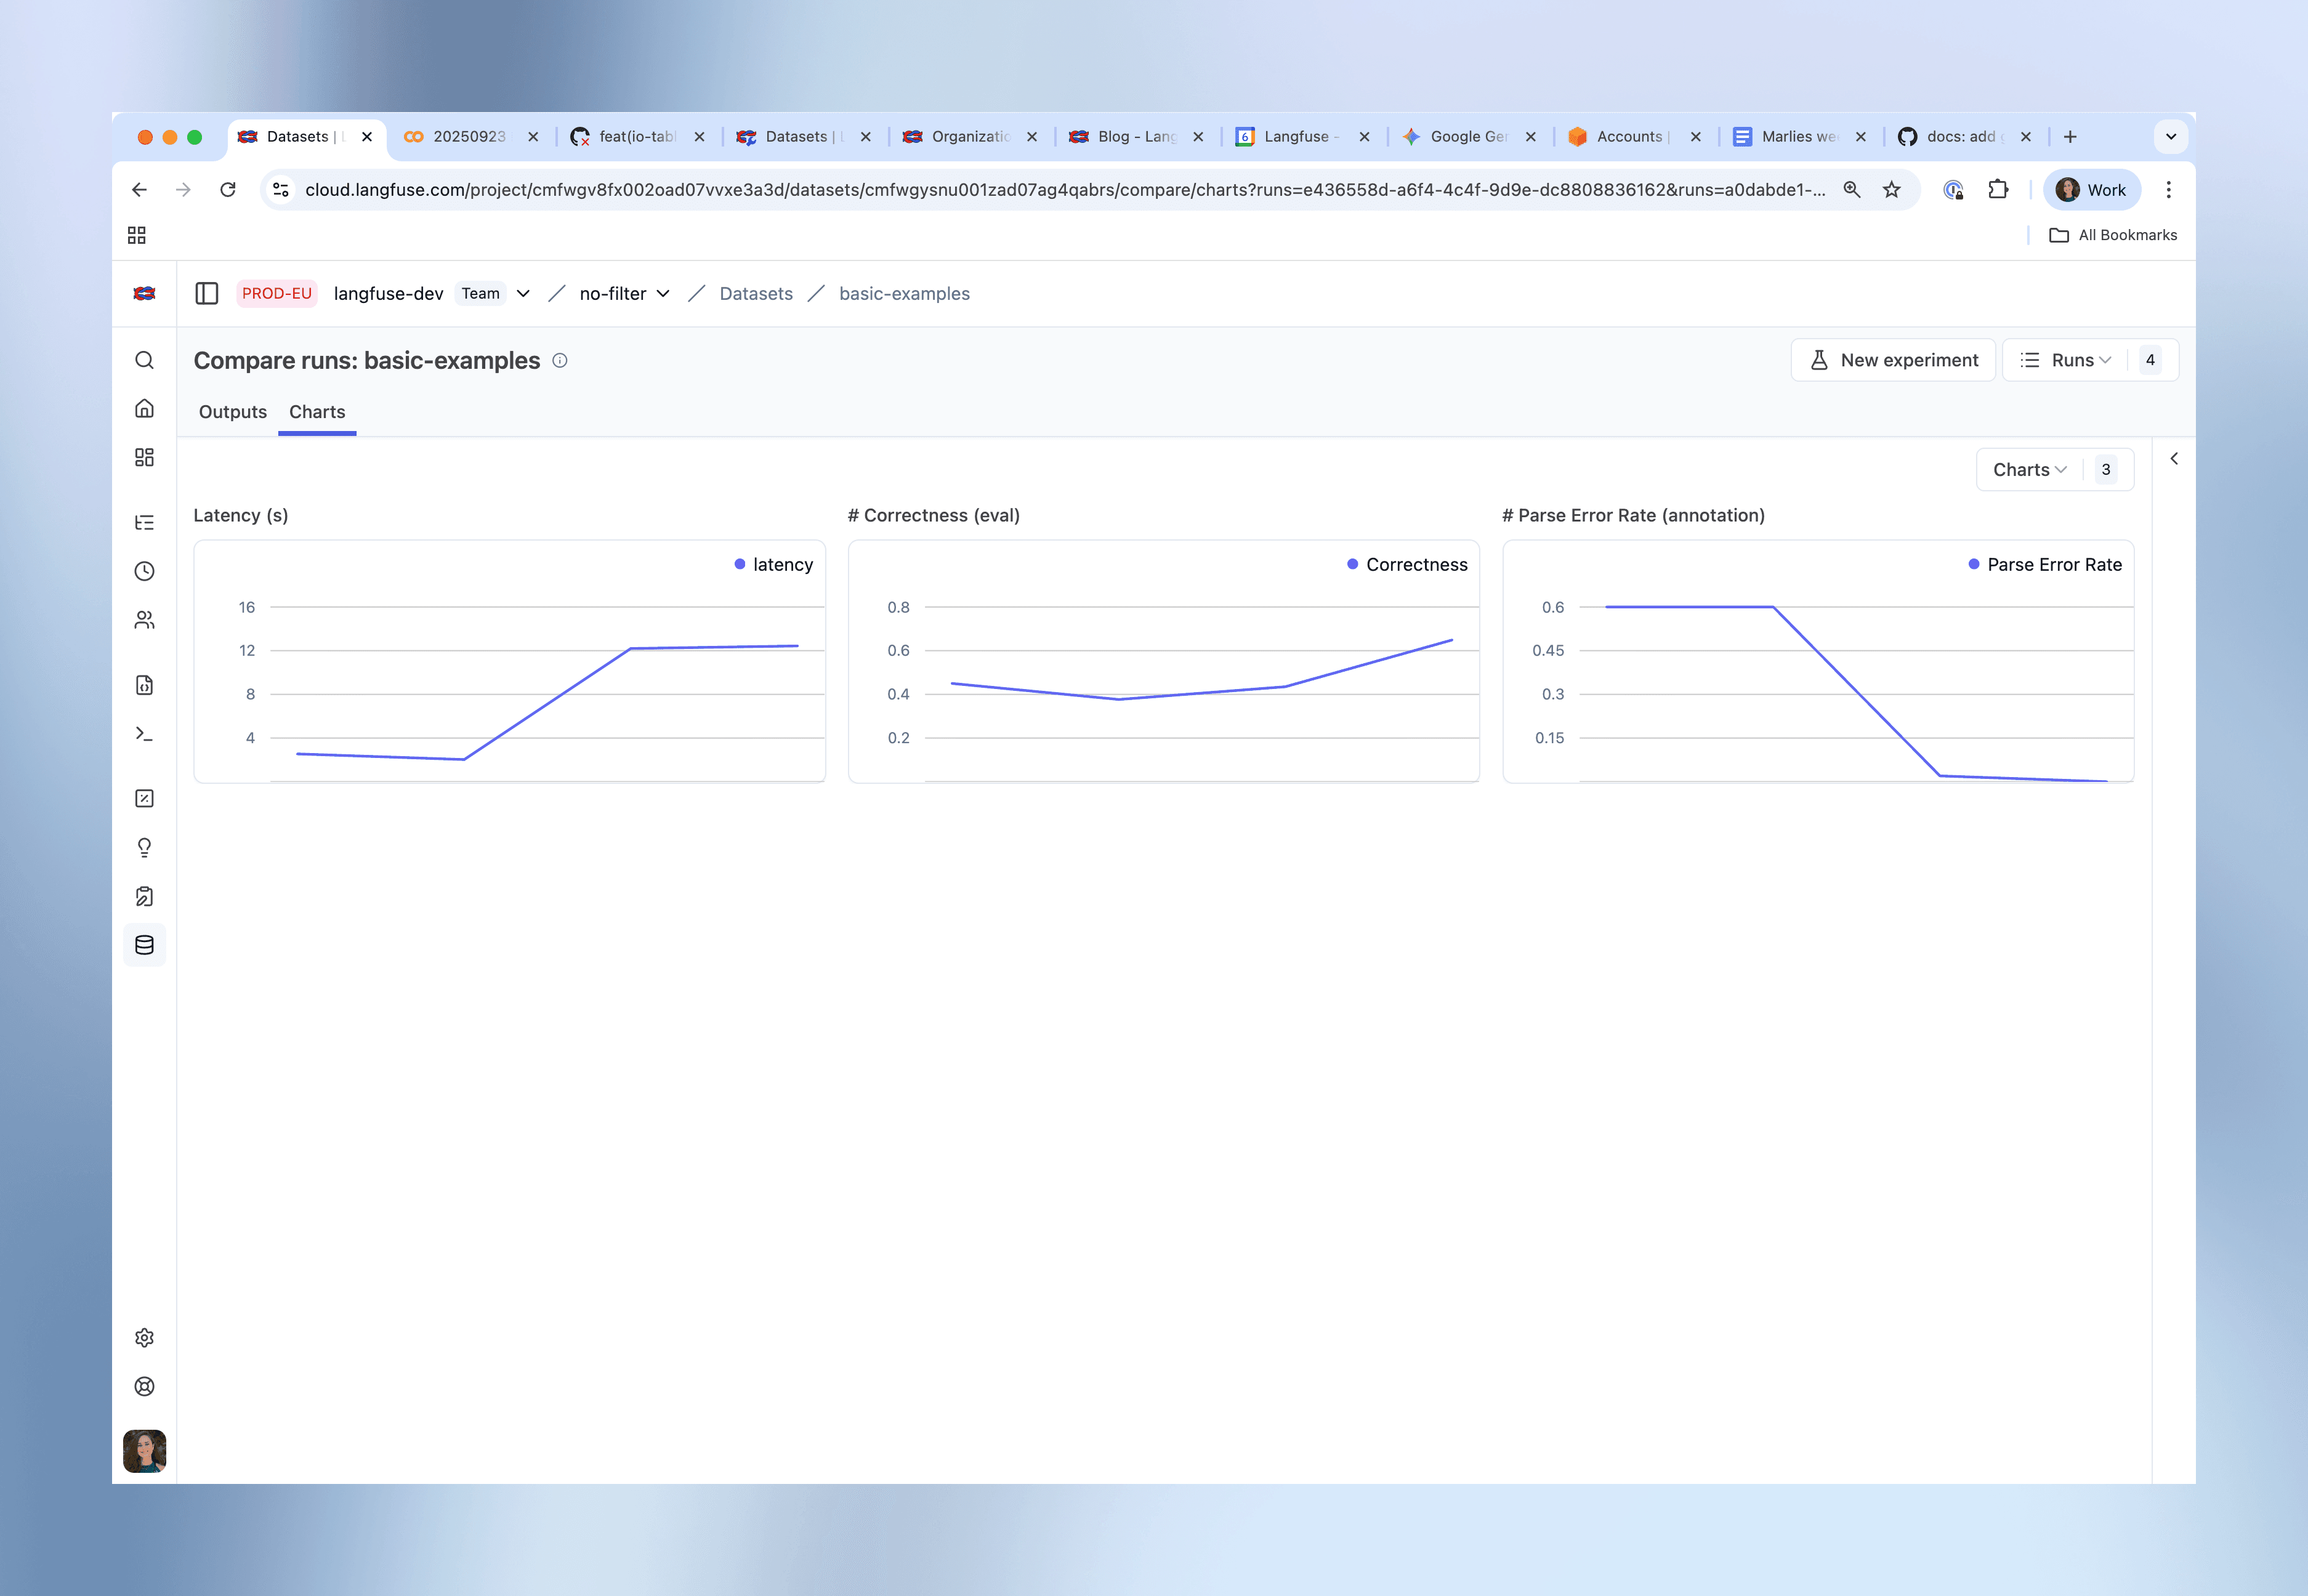
Locate your two most recent experiment runs in the table. Select both rows, the candidate run (sonnet-4.5) and the baseline run (sonnet-4), and click Compare. Set the baseline run as baseline in the UI. Our mental model for analysis in this view follows a 3-step drill down:
Step 1: Review Aggregate Metrics
Navigate to the “Charts” tab. This view presents a high-level summary of relevant metrics and first signal how baseline and candidate experiment compare. An improvement in a given evaluation score may not be worth an unacceptable regression in cost.

Step 2: Isolate Regressions and perform Root Cause Analysis
Averages can hide outliers. A 4% average improvement can hide a 16% regression on critical cases. The next step is to hunt for these failures in the main “Outputs” tab. This table renders the Baseline and Candidate outputs side-by-side for each test case. Rows are matched using stable identifiers from the dataset to ensure a true apples-to-apples comparison. Visual indicators (green/red deltas) for evaluation scores, cost, and latency allow for rapid scanning of item-level changes.
The goal is to build a high-priority worklist. Use the UI tools systematically:
- Filtering: This is the primary tool. Use column header summaries to filter for specific value failures (e.g.,
Candidate Correctness < 0.3). - [Coming soon] Sorting: Sort the table by the scores to surface the single worst-performing items immediately.
This filtered, sorted list is the work queue.
Now, select a specific row from this list to open its execution trace. The trace is the debugger. Analysis at this level has two parts:
- Analyze the Output: Compare the
Baseline Outputvs. theCandidate Outputto understand the behavioral change that caused the regression. - Validate the Evaluator: Critically, check the evaluator’s
scoreagainst theoutput. Does the score seem correct? If a good output receives a bad score (or vice versa), the evaluator is broken. Fixing the evaluation logic is a prerequisite to trusting the experiment.
3. Exploring Results with Human Annotation
Automated evaluators help identify that a regression occurred (e.g., correctness: 0.0) but often fail to capture why in a structured way. This is the entry point for Human in the loop evaluation.
Our goal is to convert expert human judgment into a structured, queryable score. Given our example, this might involve a two-stage annotation workflow. Note that annotation workflows strongly differ by use case. For more detail please see our recent blog post on Error Analysis.
- First Pass (Engineer): Triage
The engineer, having isolated regressions in Step 2, performs a rapid first pass.
- Action: Use Annotation Mode to efficiently navigate the filtered regression list. The engineer annotates the
sonnet-4.5(candidate) outputs directly. The UI allows quickly navigating between annotation-ready cells by clicking theAnnotatebutton in the output cell. - Annotation: Apply a simple triage score (e.g.,
review_status: fail). This marks the item and creates a worklist for deeper analysis.
- Second Pass (Subject Matter Expert): Classification
A Subject Matter Expert (SME) takes over, reviewing only the pre-filtered compare view (eg Candidate review_status = fail).
- Action: Filter the experiment view for
score.review_status = 'fail'. - Annotation**:** The SME’s task is failure classification. They review the failure and apply a second, more granular score (e.g.,
failure_mode: Hallucination,failure_mode: Irrelevant,failure_mode: Formatting).
This workflow converts automated regression signals into a structured failure dataset, providing a clear, data-driven mandate for the next engineering iteration.
Takeaway
Experiments provide a core feedback loop for AI engineering. They separate subjective tweaking from systematic development.
This guide provided a methodology:
- Run: Execute the
TaskagainstDataand assess resulting outputs usingEvaluators. - Analyze: Compare the candidate run to a baseline in a top-down funnel (Aggregate Metrics → Item-level Diff → Trace-level Debugging).
- Action: Use Human annotation to convert ambiguous regressions into a structured, classified failure dataset.
Adopting this systematic evaluation process helps provide a solid foundation for shipping reliable, high-quality AI applications.