Monitors and Alerts
 Mark Salpeter
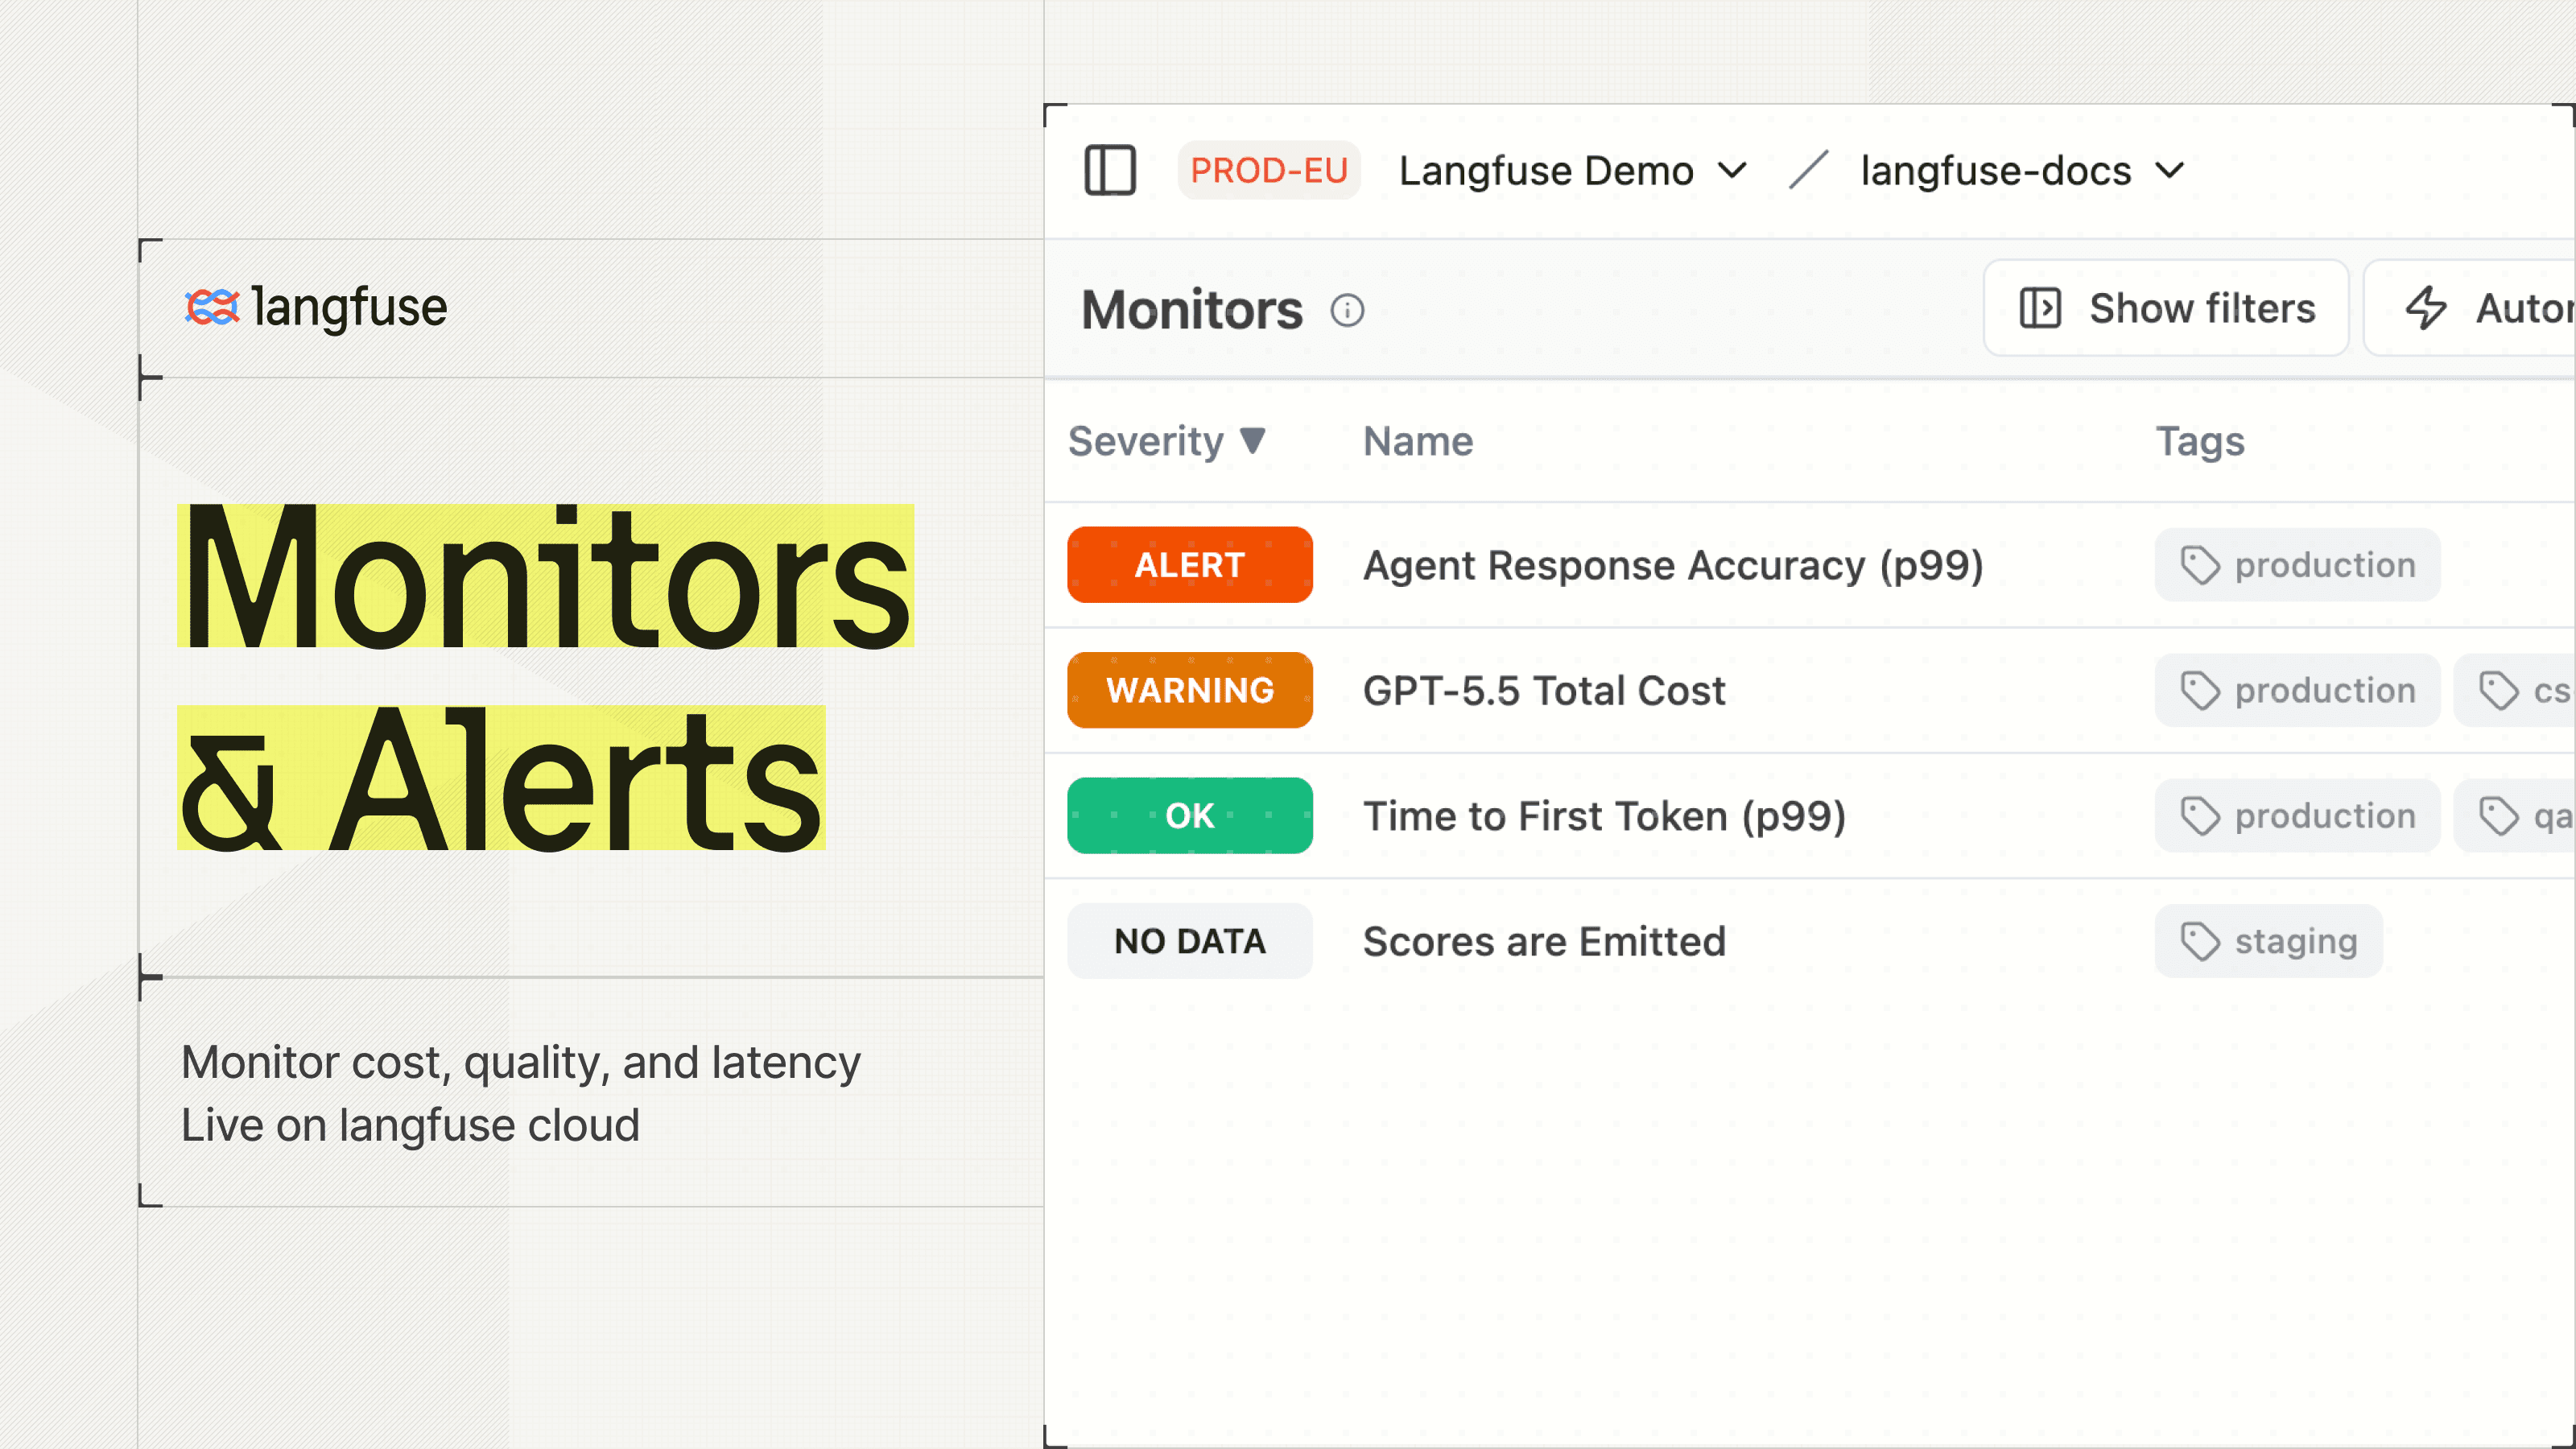
Create monitors that watch cost, quality, and latency metrics and notify your team over Slack, webhooks, or GitHub Actions when they move outside expected ranges.
You can now set threshold-based monitors on your LLM application metrics and catch cost and quality issues before they impact your users. Pick a metric, define the range you expect it to stay within, and get notified the moment it drifts.
- Catch a sudden cost spike when average cost per trace crosses a ceiling.
- Catch a quality drop when an evaluation score falls below your bar.
- Catch a latency regression when p95 latency for a model climbs past your SLA.
When a threshold is breached, the monitor fires through your linked automations — post a formatted message to Slack, HTTP POST to a webhook, or trigger a GitHub Actions workflow so your team and your pipelines can respond automatically.
Alerts are available on Langfuse Cloud and on self-hosted Langfuse v4. Self-hosted deployments have no alert limit.
Alerts page. Click “Create Alert”, set Measure to Latency and Aggregation to p95, enter 8000 as the ALERT threshold (milliseconds) and choose “1 hour” for Over the past. The live preview marks the threshold. The project's webhook automation is ticked under Automations; click “Create Alert” to add the monitor to the alerts list.