Analytics
Beta. The Langfuse AI Gateway is in public beta and can still change.
The Analytics page shows what your organization spends on the gateway and who uses it.
You can find it under Organization settings → AI Gateway → Analytics. What you see depends on your role:
- Owners and admins see all gateway usage in the organization, including the User filter and cost and requests per user.
- People with the AI Gateway role see only requests made with their own gateway keys.
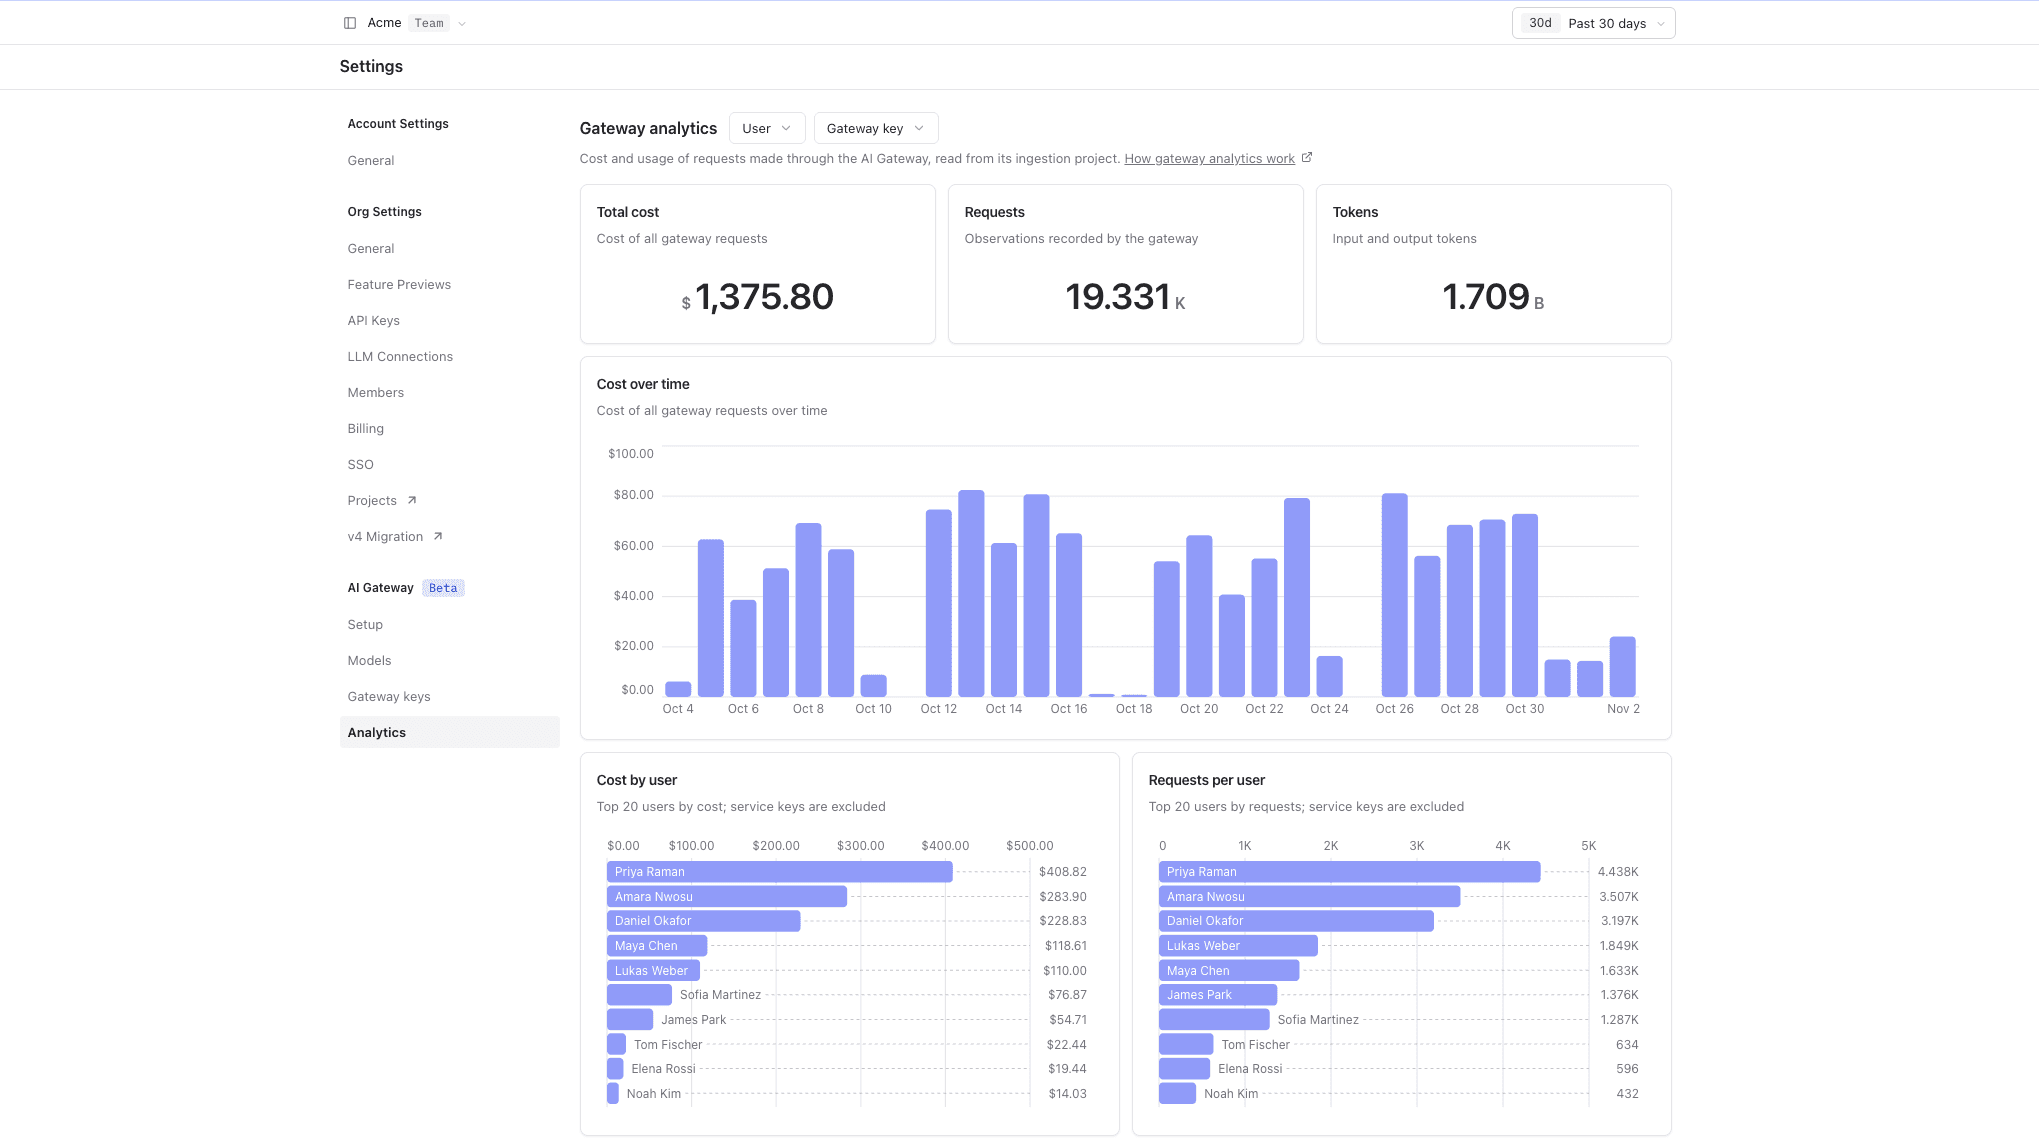
Charts are only using gateway data
The charts read the generations the gateway records in its ingestion project. Only calls made with a gateway key are considered. SDK traces sent to the same project don't impact gateway analytics numbers.
Analytics need recorded traces. USAGE ingestion
mode is enough. On
self-hosted Langfuse with ingestion mode NONE, the page shows "Gateway
requests are not recorded" instead of charts. Cost is subject to the known
cost bugs.
Build your own dashboards
Gateway traces are regular Langfuse traces, so admins and owners can build their own custom dashboards in the ingestion project:
- To limit a chart to gateway traffic, filter on the metadata key
langfuse.gateway.api_key.id. - To chart a single team or cost center, add key metadata when you create keys and filter on
langfuse.gateway.api_key.metadata.<key>.
Last updated on