Score Analytics with Multi-Score Comparison
Validate evaluation reliability and uncover insights with comprehensive score analysis. Compare different evaluation methods, track trends over time, and measure agreement between human annotators and LLM judges.
Score Analytics now provides comprehensive tools for analyzing and comparing evaluation scores across your LLM application. Whether you're validating that different LLM judges agree, checking if human annotations align with automated evaluations, or exploring score distributions and trends, Score Analytics gives you the insights you need to trust your evaluation process.
What's New
- Multi-Score Comparison: Compare any two scores of the same data type to validate evaluation reliability. View correlation metrics, confusion matrices, and alignment patterns between different evaluation sources.
- Statistical Validation: Measure agreement with Pearson correlation, Cohen's Kappa, F1 scores, and other metrics. Badge indicators show interpretation at a glance (e.g., "Very Strong" for correlations above 0.9).
- Multi-Data Type Support: Analyze numeric scores (continuous ratings), categorical scores (discrete labels), or boolean scores (binary classifications) with type-appropriate visualizations and statistics.
- Matched vs All Analysis: Toggle between matched data (scores attached to the same parent object) to measure alignment, or view all data to understand coverage and individual score distributions.
- Temporal Insights: Track how scores evolve over time with configurable intervals from seconds to months. Identify quality regressions or improvements in your application.
How It Works

Single Score Analysis
- Navigate to Scores > Analytics in your project
- Select a score from the dropdown to view its distribution and trend over time
- Filter by object type (Traces, Observations, Sessions, or Dataset Run Items) and time range
- Review summary statistics including mean, standard deviation, and total count
Two-Score Comparison
- Select a second score to enable comparison mode
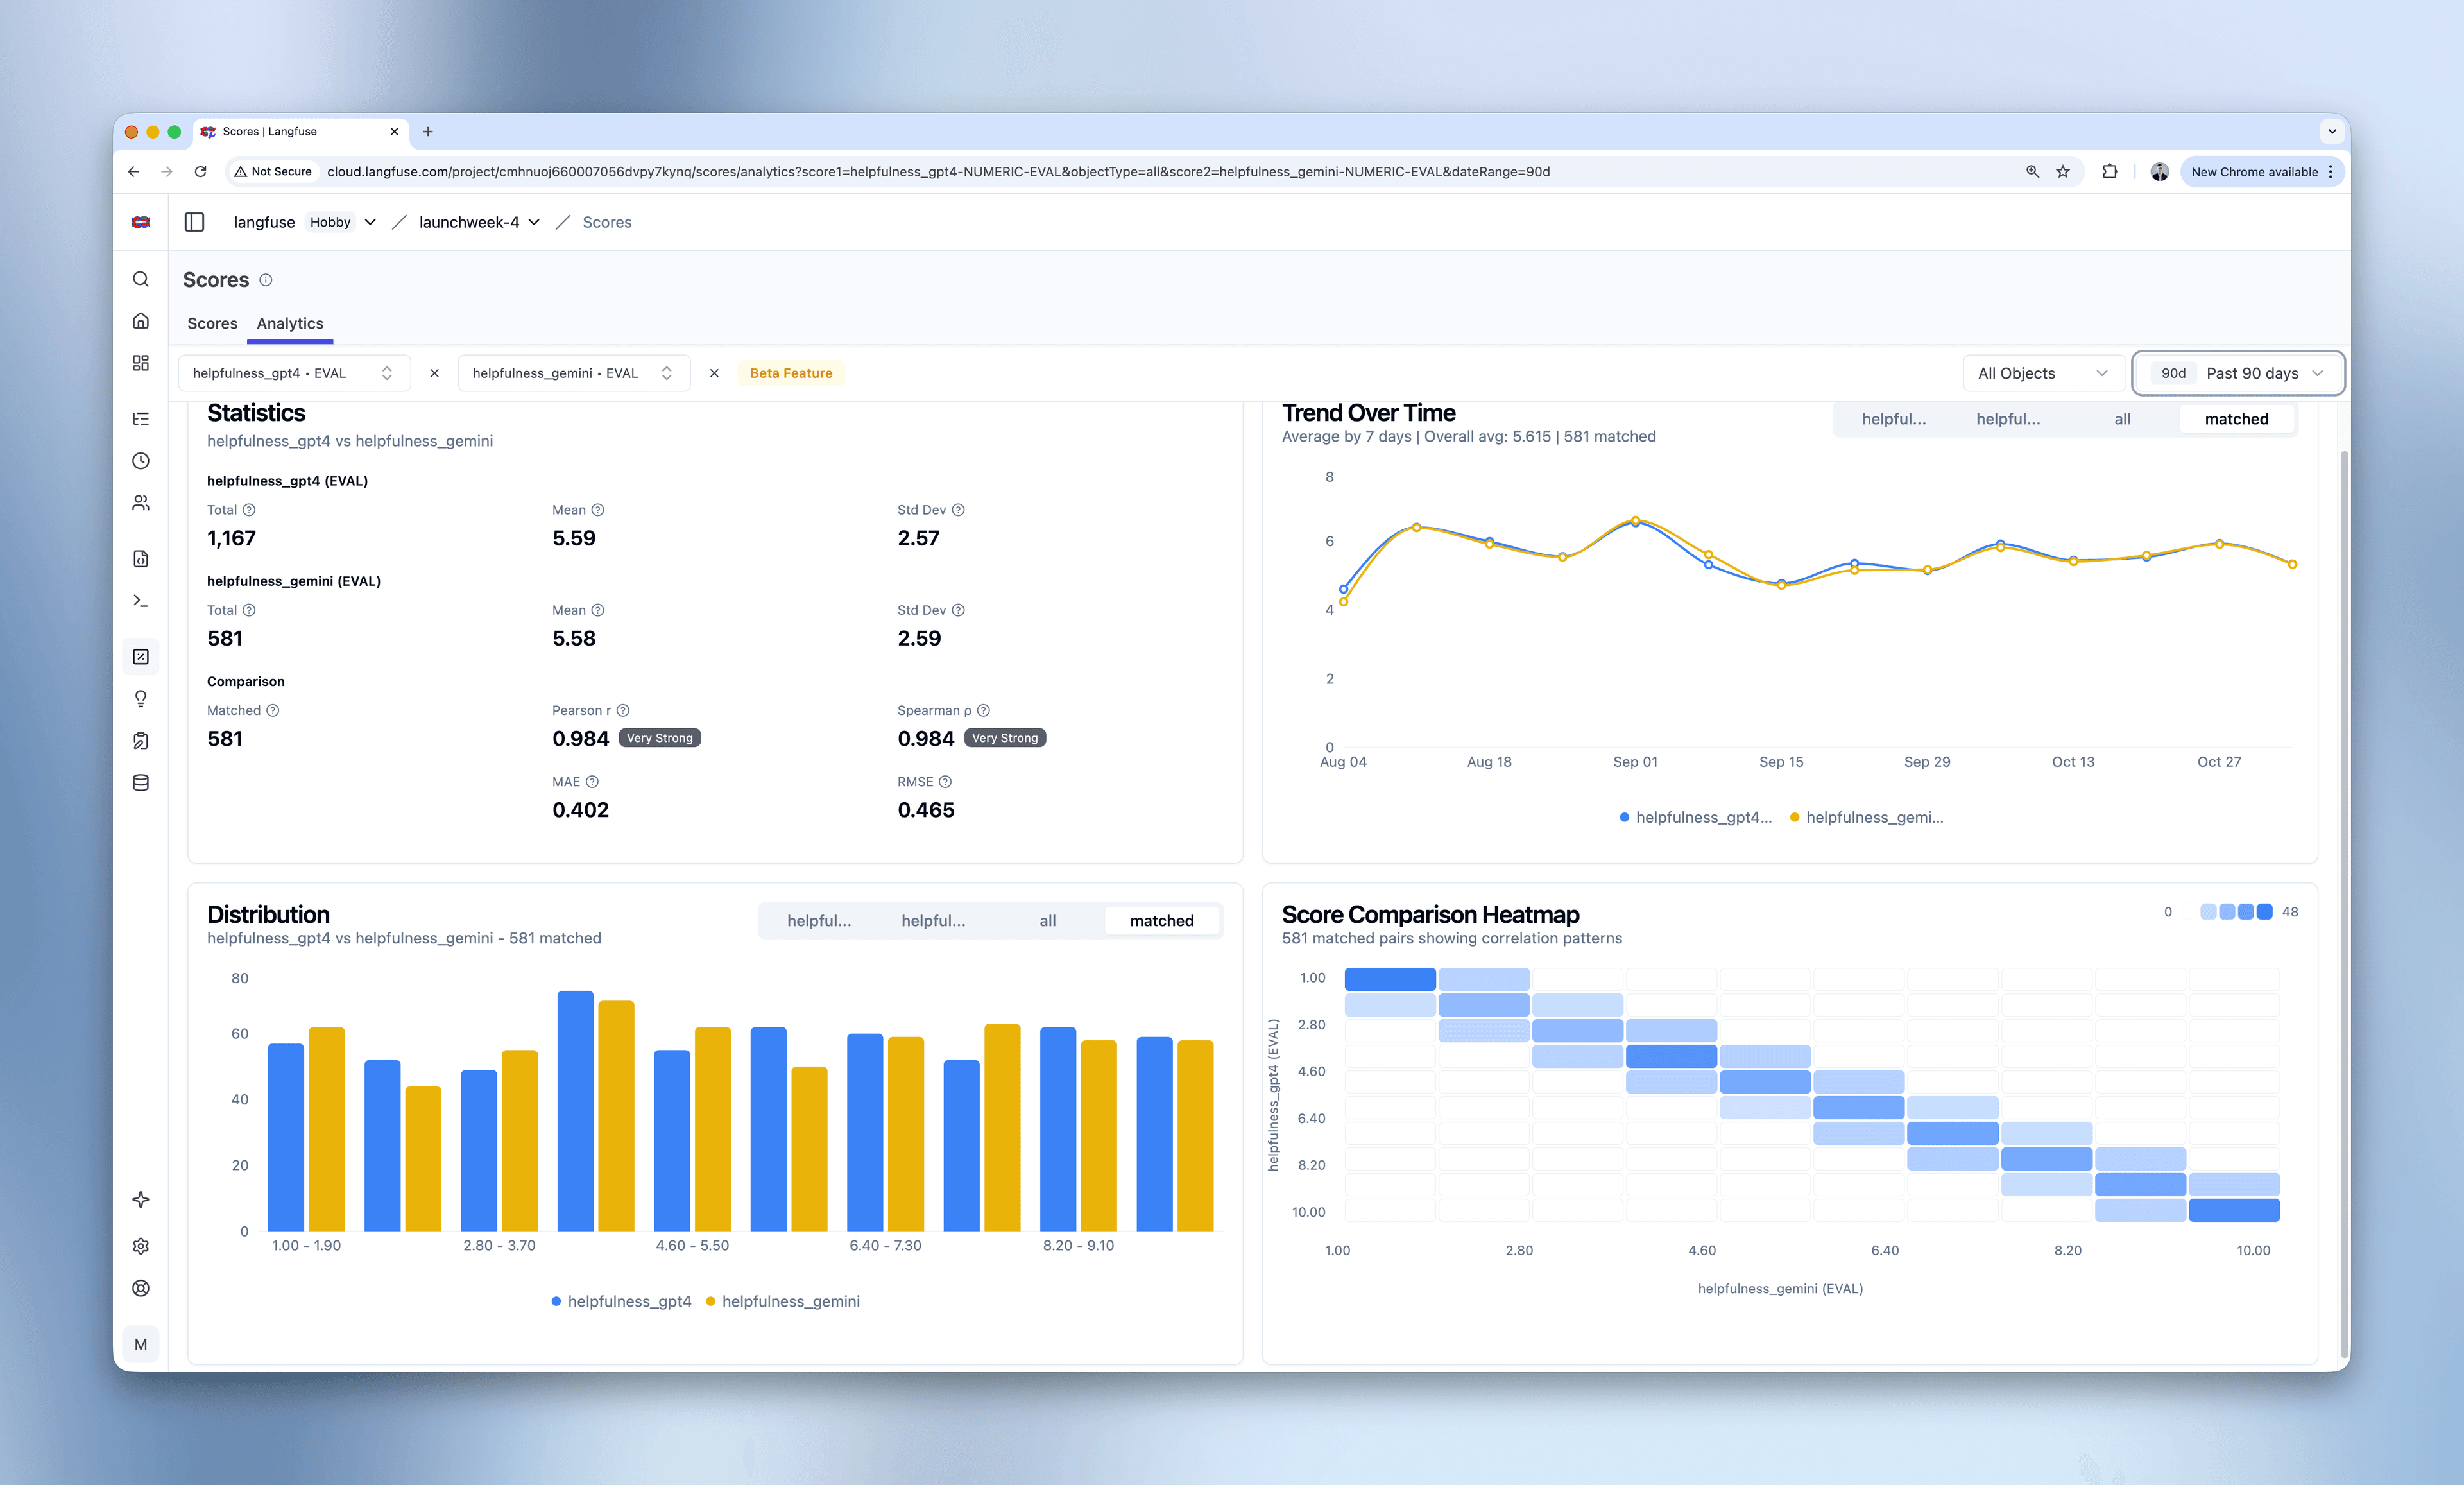
- View correlation metrics in the Statistics card showing how well the scores align
- Examine the Score Comparison Heatmap showing correlation patterns:
- Strong diagonal patterns indicate good agreement
- Anti-diagonal patterns reveal negative correlations
- Scattered patterns suggest low alignment
- Compare distributions side-by-side in the matched vs all tabs
- Track how both scores trend together over time
Self-Serve Dashboards: Single-score Score Analytics continue to be available on our self-serve dashboards. Multi-score comparison with correlation analysis requires different data computation that is currently not supported by the metrics API powering self-serve dashboards.
Example Use Cases
Validate LLM Judge Reliability: Compare helpfulness scores from GPT-4 vs Gemini. If Pearson correlation shows 0.98+ ("Very Strong"), both judges are aligned and your evaluation is reliable.
Human-AI Annotation Agreement: Check if your AI evaluations match human annotations. High Cohen's Kappa (0.8+) means AI can augment or replace some manual annotation work.
Identify Coverage Gaps: Toggle between "all" and "matched" tabs to see what percentage of your traces have evaluations. If only 50% are matched, you may need broader evaluation coverage.
Spot Quality Regressions: Monitor scores over time to detect drops after deployments. Temporal analysis helps you quickly identify and investigate quality issues.
Discover Feature Relationships: Compare boolean scores like "has_tool_use" vs "has_hallucination" to uncover insights. Negative correlation patterns show that tool use reduces hallucinations.
Getting Started
- Ensure you have score data in your Langfuse project
- Navigate to Scores > Analytics
- Select one or two scores to start analyzing
- Explore different object types and time ranges to find insights
Going Deeper
Score Analytics provides a lightweight, zero-configuration way to analyze your scores out of the box. For more advanced analyses, the experiment SDK helps expert users drill down even deeper into their evaluation data.