Score Analytics
Score Analytics provides a lightweight, zero-configuration way to analyze your evaluation data out of the box. Whether you’re validating that different LLM judges produce consistent results, checking if human annotations align with automated evaluations, or exploring score distributions and trends, Score Analytics helps you build confidence in your evaluation process.
Why use Score Analytics?
Score Analytics complements Langfuse’s experiment SDK and self-serve dashboards by offering instant, zero-configuration score analysis:
- Lightweight Setup: No configuration needed—start analyzing scores immediately after they’re ingested
- Quick Validation: Compare scores from different sources (e.g., GPT-4 vs Gemini as judges) to measure agreement and ensure reliability
- Out-of-the-Box Insights: Visualize distributions, track trends, and discover correlations without custom dashboard configuration
- Statistical Rigor: Access metrics like Pearson correlation, Cohen’s Kappa, and F1 scores with built-in interpretation
For advanced analyses requiring custom metrics or complex comparisons, use the experiment SDK for deeper investigation.
Getting Started
Prerequisites
Ensure you have score data in your Langfuse project from any evaluation method:
- Human annotations
- LLM-as-a-Judge evaluations
- Custom scores ingested via SDK or API
Navigate to Score Analytics
- Go to your project in Langfuse
- Click on
Scoresin the navigation menu - Select the
Analyticstab
Analyze a Single Score
- Select a score from the first dropdown menu
- Choose an object type to analyze (Traces, Observations, Sessions, or Dataset Run Items)
- Set a time range using the date picker (e.g., Past 90 days)
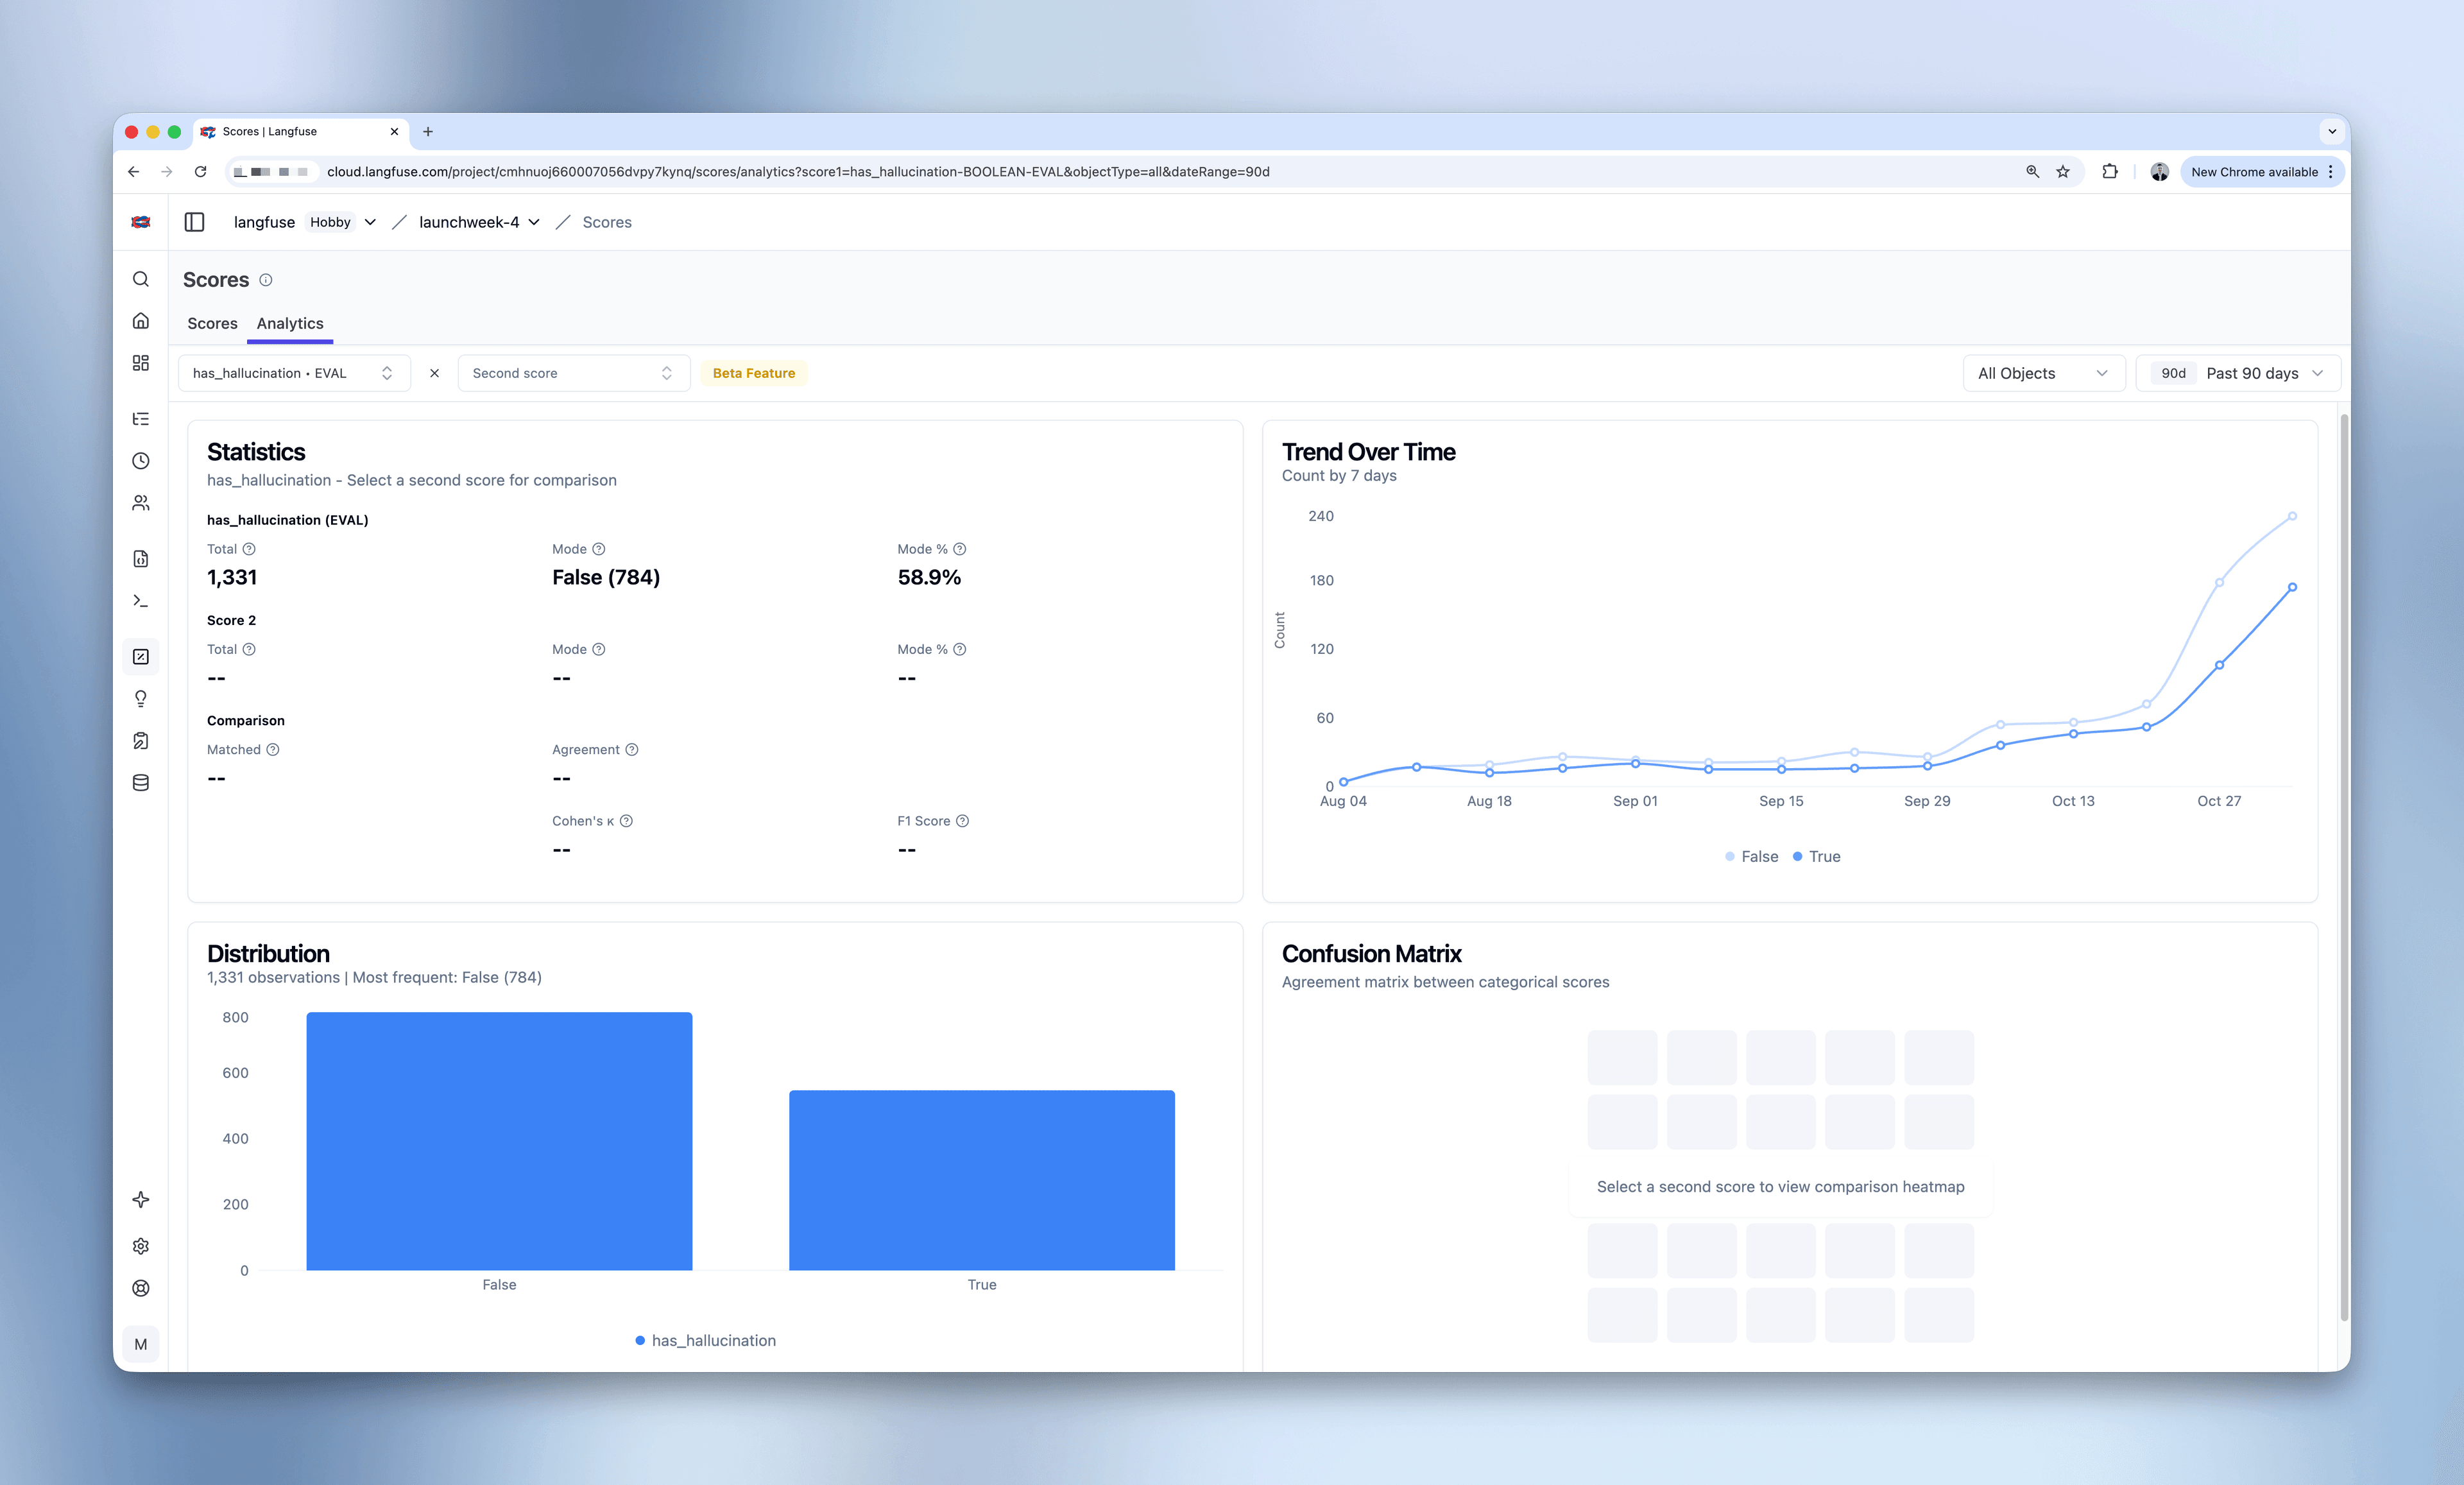
- Review the Statistics card showing total count, mean/mode, and standard deviation
- Explore the Distribution chart to see how score values are spread
- Examine the Trend Over Time chart to track temporal patterns

Compare Two Scores
- Select a second score from the second dropdown menu (must be the same data type)
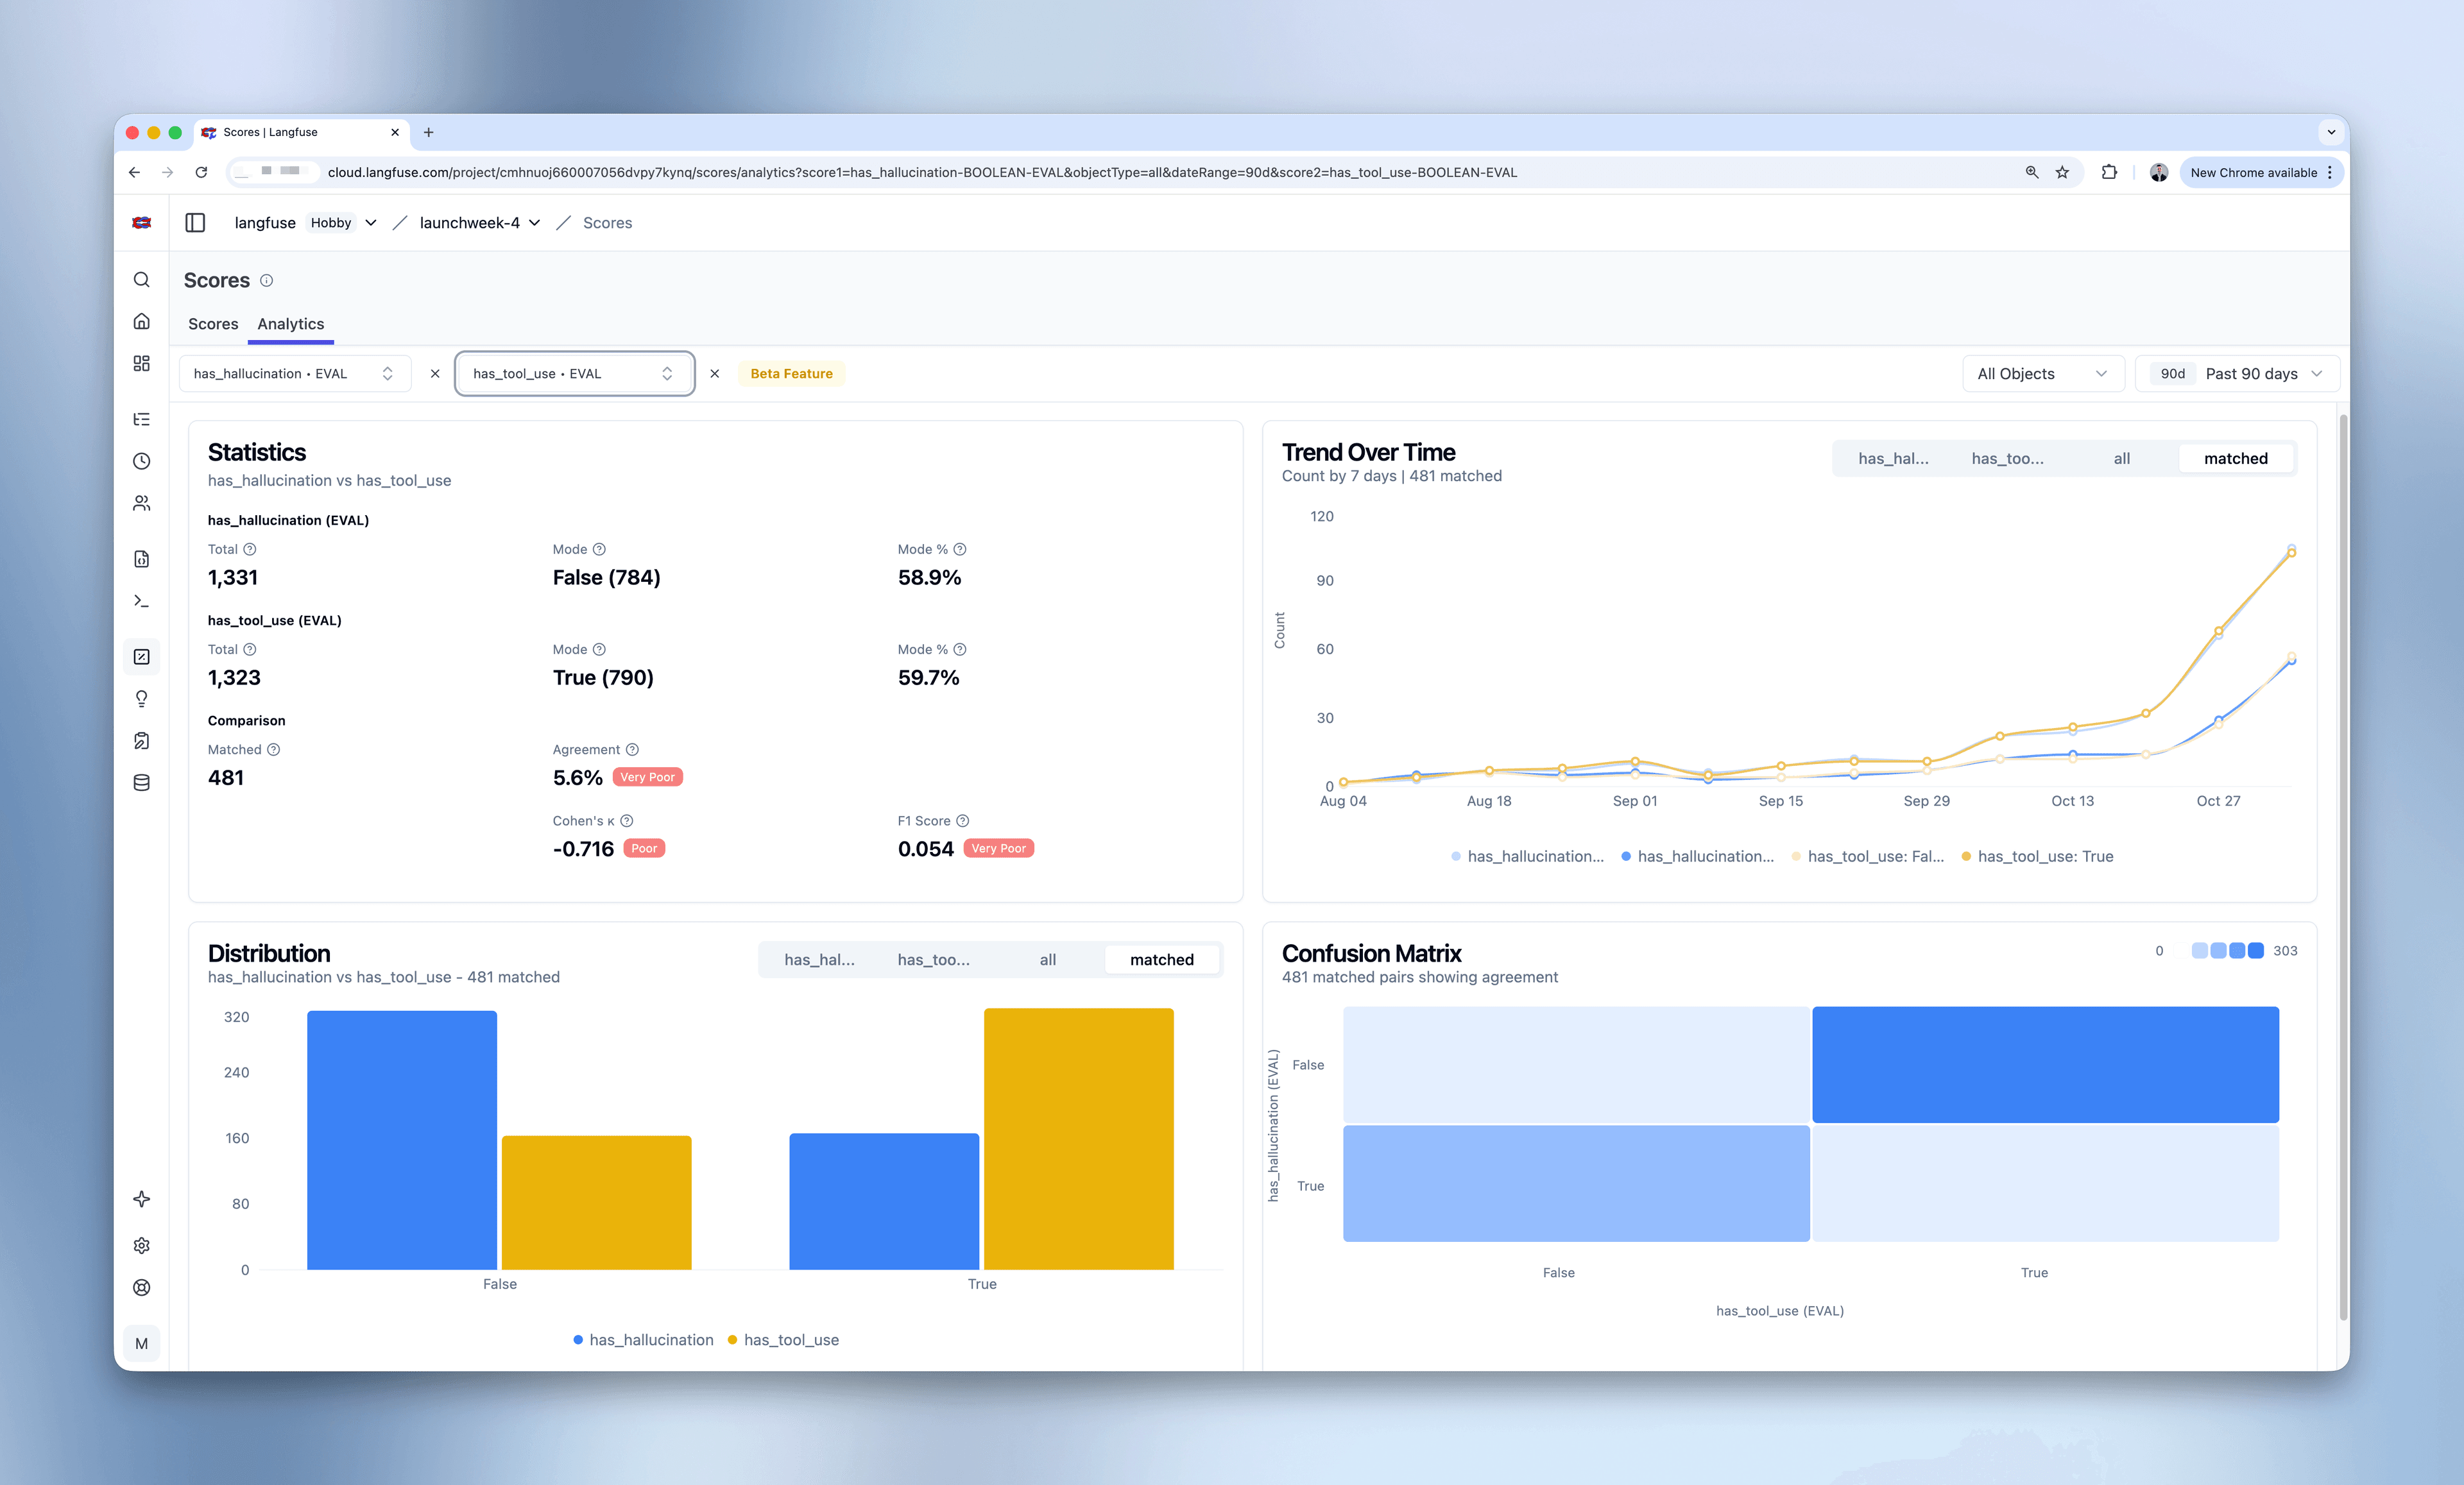
- Review the comparison metrics in the Statistics card:
- Matched count (scores attached to the same parent object)
- Correlation metrics (Pearson, Spearman)
- Error metrics (MAE, RMSE for numeric scores)
- Agreement metrics (Cohen’s Kappa, F1, Overall Agreement for categorical/boolean)
- Examine the Score Comparison Heatmap:
- Strong diagonal patterns indicate good agreement
- Anti-diagonal patterns reveal negative correlations
- Scattered patterns suggest low alignment
- Compare distributions in the matched vs all tabs
- Track how both scores trend together over time

Key Features
Multi-Data Type Support
Score Analytics automatically adapts visualizations and metrics based on score data types:
Numeric Scores (continuous values like 1-10 ratings)
- Distribution: Histogram with 10 bins showing value ranges
- Comparison: 10×10 heatmap showing correlation patterns
- Metrics: Pearson correlation, Spearman correlation, MAE (Mean Absolute Error), RMSE (Root Mean Square Error)
Categorical Scores (discrete categories like “good/bad/neutral”)
- Distribution: Bar chart showing count per category
- Comparison: N×M confusion matrix showing how categories align
- Metrics: Cohen’s Kappa, F1 Score, Overall Agreement
Boolean Scores (true/false binary values)
- Distribution: Bar chart with 2 categories
- Comparison: 2×2 confusion matrix
- Metrics: Cohen’s Kappa, F1 Score, Overall Agreement
Matched vs All Data Analysis
Score Analytics provides two views for understanding your data:
Matched Data (default tab)
- Shows only parent objects (traces, observations, sessions, or dataset run items) that have both selected scores attached
- Enables valid comparison between evaluation methods
- A match exists when two scores relate to the same parent object
- Use this view to measure agreement and correlation
All Data (individual score tabs)
- Shows complete distribution of each score independently
- Reveals evaluation coverage (how many parent objects have each score)
- Helps identify gaps in your evaluation strategy
Time-Based Analysis
The Trend Over Time chart helps you monitor score patterns with:
- Configurable intervals: From minutes to years (5m, 30m, 1h, 3h, 1d, 7d, 30d, 90d, 1y)
- Automatic interval selection: Smart defaults based on your selected time range
- Gap filling: Missing time periods are filled with zeros for consistent visualization
- Average calculations: Subtitle shows overall average for the time period
Statistical Metrics
Score Analytics provides industry-standard statistical metrics with interpretation guidance:
Correlation Metrics (for numeric scores)
Pearson Correlation: Measures linear relationship between scores. Values range from -1 (perfect negative) to 1 (perfect positive).
- 0.9-1.0: Very Strong correlation
- 0.7-0.9: Strong correlation
- 0.5-0.7: Moderate correlation
- Below 0.5: Weak correlation
Spearman Correlation: Measures monotonic relationship (rank-based). More robust to outliers than Pearson.
Error Metrics (for numeric scores)
MAE (Mean Absolute Error): Average absolute difference between scores. Lower is better.
RMSE (Root Mean Square Error): Square root of average squared differences. Penalizes larger errors more than MAE.
Agreement Metrics (for categorical/boolean scores)
Cohen’s Kappa: Measures agreement adjusted for chance. Values range from -1 to 1.
- 0.81-1.0: Almost Perfect agreement
- 0.61-0.80: Substantial agreement
- 0.41-0.60: Moderate agreement
- Below 0.41: Fair to Slight agreement
F1 Score: Harmonic mean of precision and recall. Values range from 0 to 1, with 1 being perfect.
Overall Agreement: Simple percentage of matching classifications. Not adjusted for chance agreement.
Example Use Cases
Validate LLM Judge Reliability
Scenario: You use both GPT-4 and Gemini to evaluate helpfulness. Are they producing consistent results?
Workflow:
- Select “helpfulness_gpt4-NUMERIC-EVAL” as score 1
- Select “helpfulness_gemini-NUMERIC-EVAL” as score 2
- Review Statistics card: Pearson correlation of 0.984 with “Very Strong” badge
- Examine heatmap: Strong diagonal pattern confirms alignment
- Result: Both judges agree strongly, your evaluation is reliable
Human vs AI Annotation Agreement
Scenario: You have human annotations and AI evaluations for quality. Should you trust the AI?
Workflow:
- Select “quality-CATEGORICAL-ANNOTATION” as score 1
- Select “quality-CATEGORICAL-EVAL” as score 2
- Check confusion matrix: Strong diagonal indicates good agreement
- Review Cohen’s Kappa: 0.85 shows “Almost Perfect” agreement
- Result: AI evaluations align well with human judgment
Identify Negative Correlations
Scenario: Understanding relationships between different application behaviors
Workflow:
- Select “has_tool_use-BOOLEAN-EVAL” as score 1
- Select “has_hallucination-BOOLEAN-EVAL” as score 2
- Observe confusion matrix: Anti-diagonal pattern
- Result: When your agent uses tools, it hallucinates less frequently
Track Evaluation Coverage
Scenario: How complete is your evaluation data?
Workflow:
- Select any score
- Compare the “all” tab vs “matched” tab in Distribution
- Check total counts: 1,143 individual score 1 vs 567 matched pairs
- Result: Identify that ~50% of parent objects have both scores
Detect Quality Regressions
Scenario: Did your model quality drop after a recent deployment?
Workflow:
- Select a quality or performance score
- Set time range to include pre and post-deployment periods
- Review Trend Over Time chart for any dips or changes
- Result: Quickly spot quality regressions and investigate root causes
Current Limitations
Beta Feature: Score Analytics is currently in beta. Please report any issues or feedback.
Current Constraints:
- Two scores maximum: Currently supports comparing up to two scores at a time. For multi-way comparisons, perform pairwise analyses.
- Same data type only: You can only compare scores of the same data type (numeric with numeric, categorical with categorical, boolean with boolean).
- Sampling: For performance optimization, queries expecting >100k scores (for either score1 or score2) automatically apply random sampling. This sampling approximates true random sampling and maintains statistical properties of your data. A visible indicator will show when sampling is active, and you can use time range or object type filters to narrow your analysis if you need the complete dataset.
Tips and Best Practices
Choosing Scores to Compare
- Only scores of the same data type can be compared
- Scores with different scales can be compared, but error metrics (MAE, RMSE) will be affected by scale differences
- Choose scores that evaluate similar dimensions for meaningful comparisons
Interpreting Heatmaps
- Diagonal patterns: Indicate agreement (both scores assign similar values)
- Anti-diagonal patterns: Indicate negative correlation (high values in one score correspond to low values in the other)
- Scattered patterns: Indicate low correlation or noisy data
- Cell intensity: Darker cells represent more data points in that bin combination
Understanding Matched Data
- Scores are always attached to one parent object (trace, observation, session, or dataset run item)
- A match between scores exists when they relate to the same parent object
- If matched count is much lower than individual counts, you have coverage gaps
- Some evaluation methods may be selective (e.g., only annotating edge cases)