Monitors and Alerts
- HobbyAvailable
- CoreAvailable
- ProAvailable
- EnterpriseAvailable
- Self HostedLangfuse v4+
On Langfuse Cloud, the number of monitors per organization depends on your plan: 2 (Hobby), 20 (Core), 50 (Pro), and 100 (Enterprise).
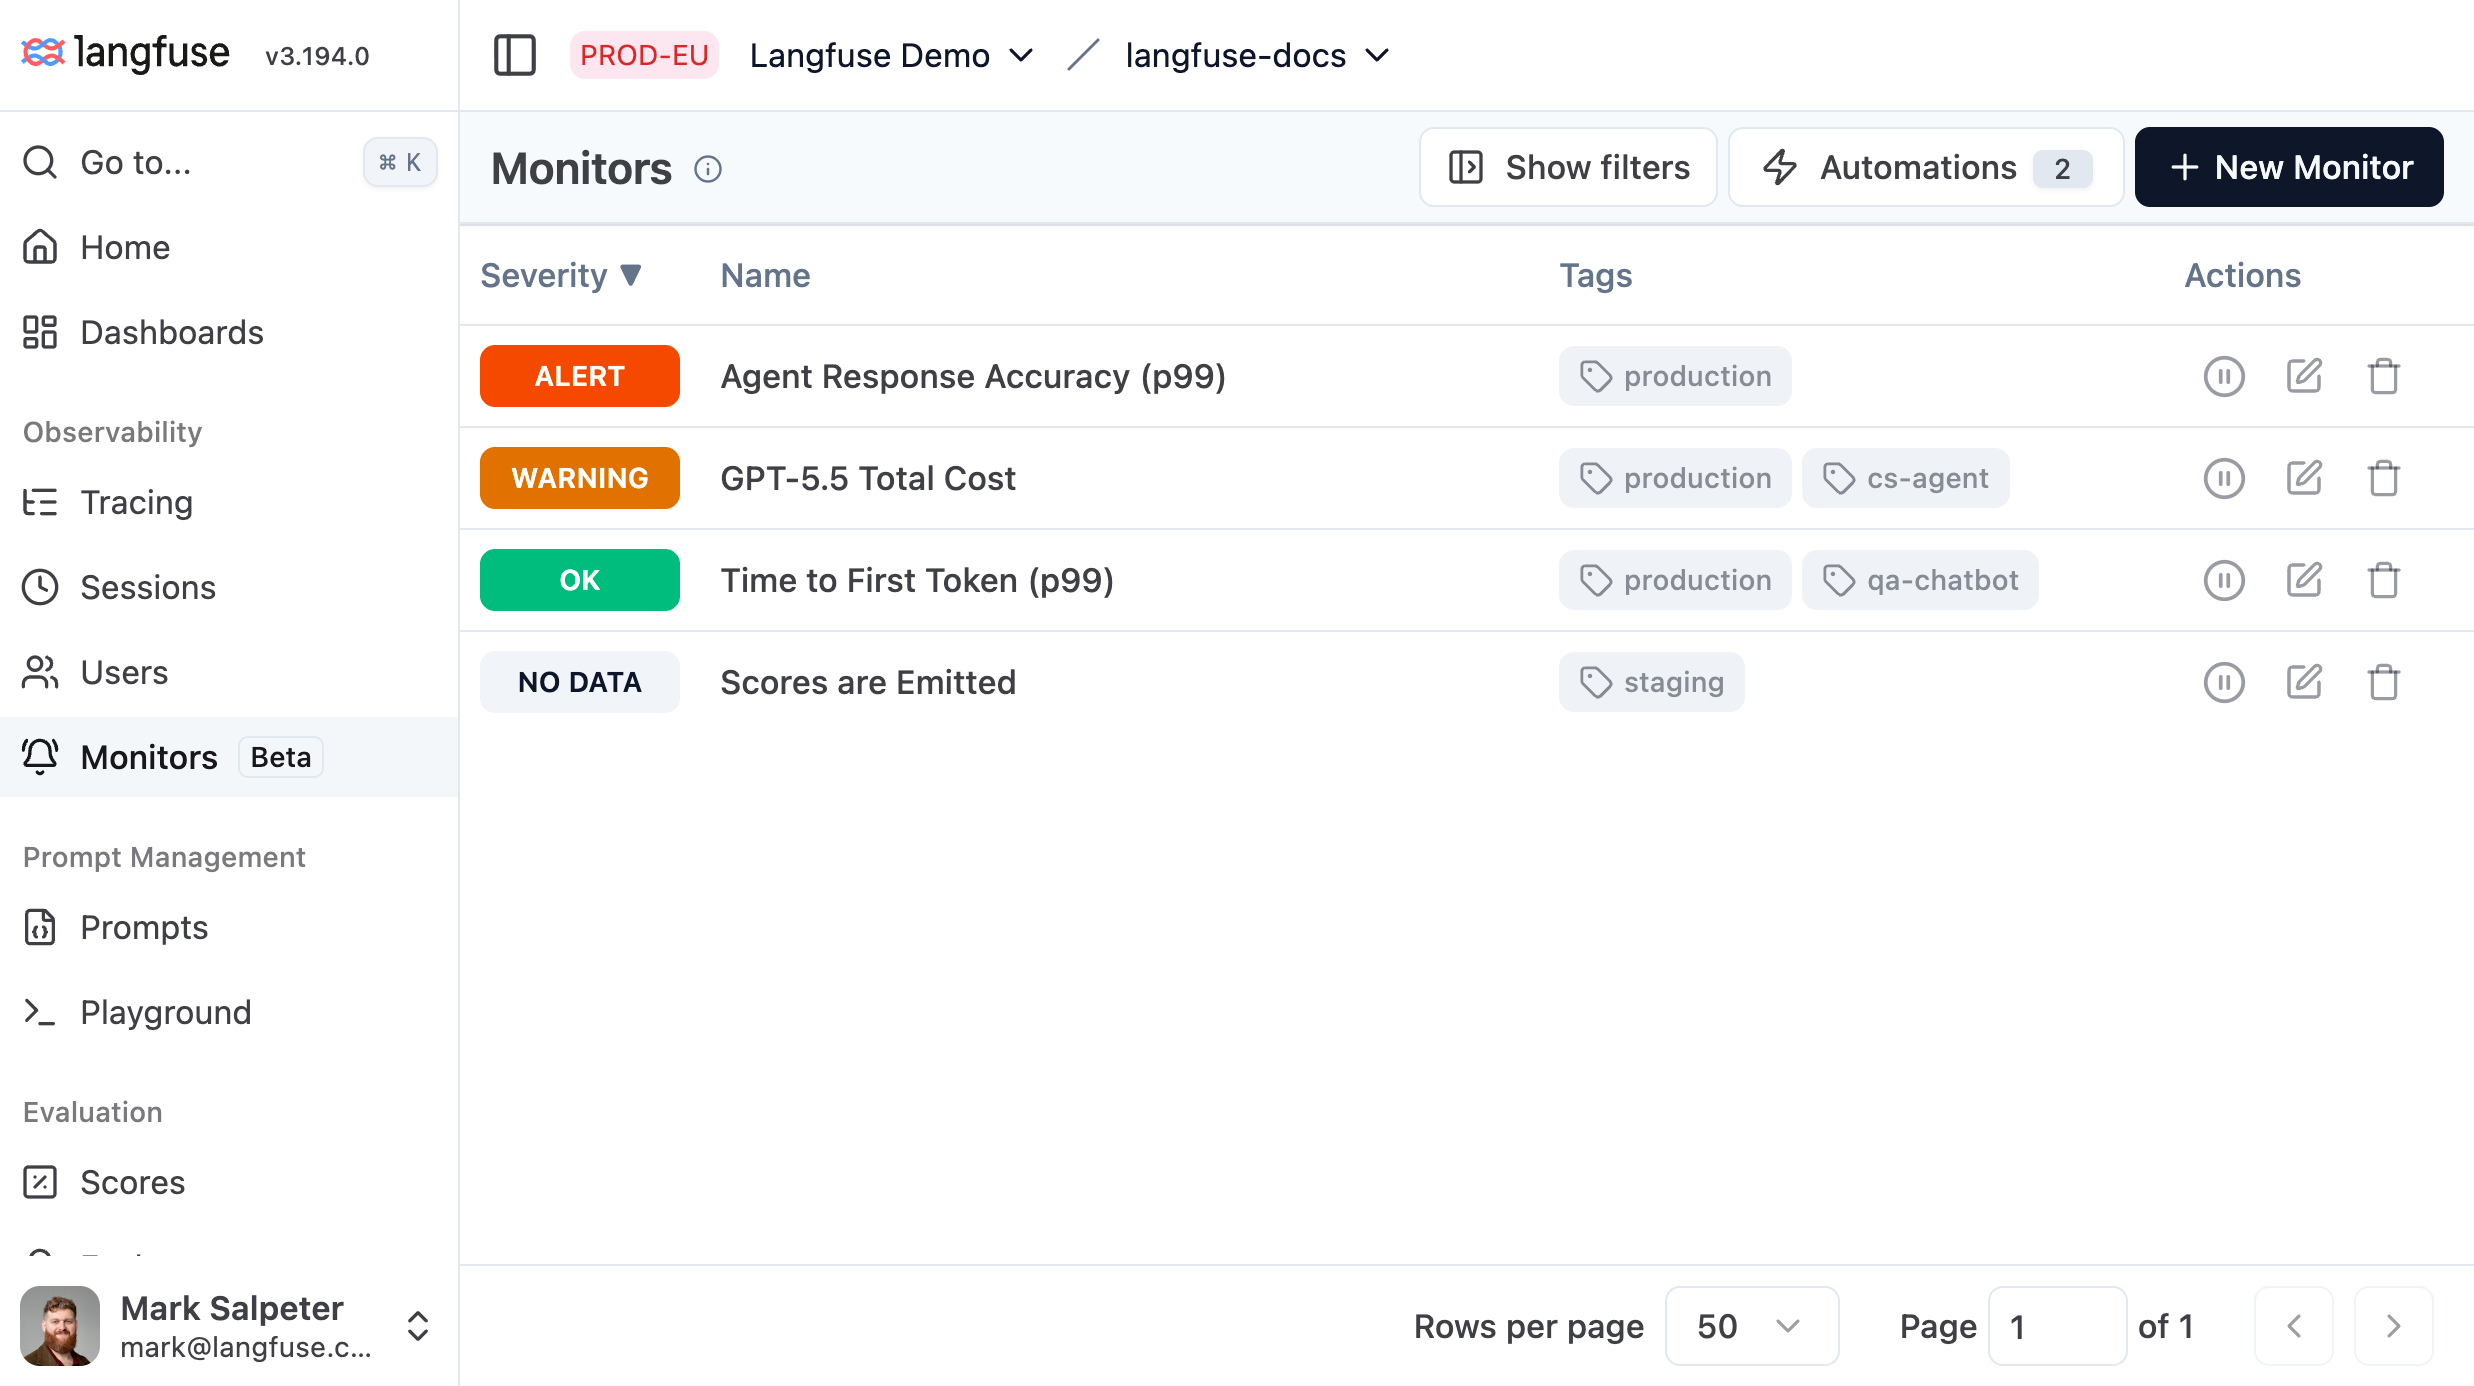
Monitors allow you to catch cost and quality issues before they impact your users.
You can receive notifications over Slack, trigger GitHub Actions, or call your own Webhooks.
Create a monitor
Navigate to Monitors in your project and click New Monitor.
Configure the metric
Choose what data the monitor measures.
| Field | Description |
|---|---|
| Data source | Observations, Scores (numeric), Scores (categorical), or Scores (boolean) |
| Metric | Aggregation + measure — e.g. avg latency, count, p95 cost |
| Filters | Narrow the dataset (model name, tags, user ID, environment, Boolean value, etc.) |
For Boolean scores, the average value is the share of scores that are true. Use it to alert on rates such as policy-check passes or detected hallucinations.
Set alert conditions
Choose what range you expect the metric values to fall within.
| Field | Description |
|---|---|
| Operator | >, ≥, <, ≤, =, ≠ — direction of the alert condition |
| Alert threshold | Required. Crossing this value sets severity to ALERT. |
| Warning threshold | Optional. Crossing this value (before the alert threshold) sets severity to WARNING. |
| Window | How far back each evaluation looks (e.g. 1 hour, 1 day, 1 week) |
Configure advanced settings (optional)
Choose special handling for edge cases when data is missing or when a monitor stays in an unresolved state for extended periods of time.
No-data handling — what happens when the query returns no data:
| Mode | Behavior |
|---|---|
| Treat missing data as 0 (default) | Treat null as 0 and compare against thresholds |
| Keep the previous severity | Hold the previous severity; emit no alert |
| Show severity NO_DATA | Record NO_DATA severity; emit no alert |
| Notify after sustained NO_DATA | Record NO_DATA severity; fire an alert after a configurable delay |
Renotify — whether to re-alert while severity stays elevated:
| Mode | Behavior |
|---|---|
Off (default) | Alert fires once on each severity transition |
Every N minutes | Re-fires every N minutes while severity persists (1–10,080 min) |
Select a notification channel
Select one or more automations from the Automations panel. When an alert fires, Langfuse publishes the event to each selected automation, which dispatches your configured actions (Slack message, webhook, etc.).
See Automations to set up actions before linking them here.
Name and save
Give the monitor a descriptive name (max 200 characters) and optional tags, then click Save. The monitor becomes ACTIVE immediately and schedules its first evaluation.
Alert states
Each monitor carries a severity that updates after every evaluation.
| Severity | Meaning |
|---|---|
UNKNOWN | Initial state — not yet evaluated |
OK | Metric is within bounds |
WARNING | Metric crossed the warning threshold |
ALERT | Metric crossed the alert threshold |
NO_DATA | Query returned no data and no-data mode is Show severity NO_DATA or Notify after sustained NO_DATA |
PAUSED | Monitor is paused; no evaluations run |
When alerts fire:
- Alert (
UNKNOWN | OK → WARNING | ALERT): always notifies. - Recovery (
WARNING | ALERT → OK): always notifies. - No data (
NO_DATA ↔ WARNING | ALERT | OK | UNKNOWN): only notifies when no-data mode is Notify after sustainedNO_DATA. - Sustained severity (
WARNING → WARNING,ALERT → ALERT): fires only when Renotify is enabled.
Pause and resume
From the monitor list or detail page, use the row actions menu to Pause or Resume a monitor. A paused monitor skips all evaluations; its severity is frozen at PAUSED. Resuming sets it back to ACTIVE and schedules the next evaluation.
Automations
Automations route monitor alerts to external systems. Each automation pairs a trigger (a monitor severity change) with an action (a notification sent to an external system).
Three notification channels are available:
| Action | What it does |
|---|---|
| Slack | Posts a formatted alert message to a Slack channel |
| Webhook | HTTP POST to your endpoint with an HMAC-signed JSON payload |
| GitHub Actions | Fires a workflow_dispatch event on a GitHub repository |
If you would like to see another channel added, please add to the GitHub discussions.
Create a monitor automation
- Navigate to Automations and click Create Automation.
- Select event source Monitor.
- Select an action type (Slack, Webhook, or GitHub Actions).
- Configure the action: provide a Slack channel, a webhook endpoint URL, or a GitHub repository dispatch URL, event type, and personal access token.
- Give the automation a name and click Save. It will appear in the Automations panel when you create or edit monitors.
Link a monitor to an automation
- Create a new monitor automation or edit an existing one.
- Create a new monitor or edit an existing one.
- Select the automation from the Automations panel found in the notifications section of the monitor editor.
- Click Save to link the monitor to the selected automations.
A monitor fires every linked automation whenever its severity transitions (see Alert states).
After 5 consecutive delivery failures, Langfuse automatically disables the automation's trigger. Re-enable it from the Automations page once the endpoint is restored.
Webhook payload
Your endpoint receives a signed JSON body:
{
  "id": "550e8400-e29b-41d4-a716-446655440000",
  "timestamp": "2024-07-10T10:30:00Z",
  "type": "monitor-alert",
  "apiVersion": "v1",
  "payload": {
    "monitorId": "monitor_abc123",
    "projectId": "proj_xyz789",
    "permalink": "https://cloud.langfuse.com/project/proj_xyz789/monitors/monitor_abc123",
    "message": {
      "title": "avg latency crossed alert threshold",
      "body": "avg latency is 1234 ms (threshold: 1000 ms) over the last 1 hour"
    },
    "severity": "ALERT",
    "timestamp": "2024-07-10T10:30:00Z",
    "fromTimestamp": "2024-07-10T09:30:00Z",
    "toTimestamp": "2024-07-10T10:30:00Z",
    "view": "observations",
    "filters": [],
    "window": "1h"
  }
}
Signature verification works identically to prompt webhooks — see Webhooks for the HMAC validation code.
GitHub Discussions
Last edited