Observability and Evals for Claude Platform (OTel)
Send OpenTelemetry traces from the Claude Platform to Langfuse, then turn those production runs into datasets, evaluations, and experiments.
What is the Claude Platform? The Claude Platform is Anthropic's first-party API platform. It runs the Messages API and Claude Managed Agents, and it can export OpenTelemetry traces from those workloads to Langfuse.
What is Langfuse? Langfuse is an open-source AI engineering platform. It helps teams trace agentic applications, debug issues, evaluate and improve quality, and monitor costs in production. Use Langfuse Cloud (hosted by Langfuse, free tier, no infrastructure to run) or self-host it.
Public beta
This integration is in public beta. It covers the first-party Claude Platform. Amazon Bedrock and Google Cloud Vertex AI are outside this setup.
What can this integration trace?
- Messages API requests: the platform request span, including the prompt and response when full content export is on. A response can contain a tool request rather than the final answer.
- Claude Managed Agents: a turn's input and output, plus child observations for model requests and platform-run tools.
- SDK client spans: client requests and tool-runner activity from the Claude SDK, connected to the platform spans for the same operation.
Your own spans (optional): local steps such as database queries or business logic, nested with the Claude request.
How it works
There are two export paths. You can use either one, or both.
- Platform export. Configure Langfuse as a destination in the Claude Console. Anthropic sends Messages API and Claude Managed Agents activity directly to your project. This path does not need a tracing library or a custom exporter in your app.
- SDK export. Configure an OpenTelemetry provider and exporter in your app. The Claude SDK emits client requests and tool-runner activity. Add your own spans to include local steps. Follow Anthropic's SDK tracing setup. SDK content export is configured separately from the platform destination's Full content setting.
Both. Send both sources to the same Langfuse project. W3C trace context connects a client request to its platform spans. The sources show different parts of the same operation.
Set up Langfuse
- Sign up for Langfuse Cloud or self-host Langfuse.
- Create or select a project. Open Settings → API Keys, create a project key pair, and note the project's data region.
Add a Langfuse destination
Open OpenTelemetry settings in the Claude Console and select Add destination.
- Select Langfuse as the provider.
- Select your Langfuse project's region. The Console offers US, EU, JP, HIPAA, and self-hosted.
- Enter the project's public key and secret key.
- Select Full content to capture message and tool content when your organization permits it.
- Under Workspaces, choose All, Selected, or All except.
- Save the destination.

Send a request and find its trace
Messages API
Set ANTHROPIC_API_KEY in your local environment. Set ANTHROPIC_MODEL to a model available in your Claude workspace. This example requires curl and Python 3. It prints the response headers so you can match request-id to the trace.
#!/usr/bin/env bash
set -euo pipefail

: "${ANTHROPIC_API_KEY:?Set your workspace API key}"
: "${ANTHROPIC_MODEL:?Set an available model}"

payload=$(python3 - <<'PY'
import json, os
print(json.dumps({
    "model": os.environ["ANTHROPIC_MODEL"],
    "max_tokens": 64,
    "messages": [{
        "role": "user",
        "content": "Reply with exactly: Langfuse OTel check passed",
    }],
}))
PY
)

curl --fail-with-body --silent --show-error --include \
  https://api.anthropic.com/v1/messages \
  -H "x-api-key: ${ANTHROPIC_API_KEY}" \
  -H 'anthropic-version: 2023-06-01' \
  -H 'content-type: application/json' \
  --data "$payload"
Allow about a minute after enabling export. Check Delivery in the Claude Console. In Langfuse, open Tracing and find the request. Match anthropic.request.id to the response request-id. Platform spans have service.name set to claude-platform.
Claude Managed Agents
Run a session in the enabled workspace. Its agent turns, model requests, and platform-run tools appear as observations in Langfuse.
Read your trace
These examples use platform export and optional SDK tracing.
Messages API
Select the platform anthropic.messages.create span. With Full content enabled, this platform request span contains the prompt and response. A response can contain a tool request rather than the final answer. Follow the next request to see the result after the tool runs.
The child anthropic.model_request spans show model usage and timing, but do not contain the prompt or response. To read that content, select the parent anthropic.messages.create server span. An empty model preview does not mean that content export failed.
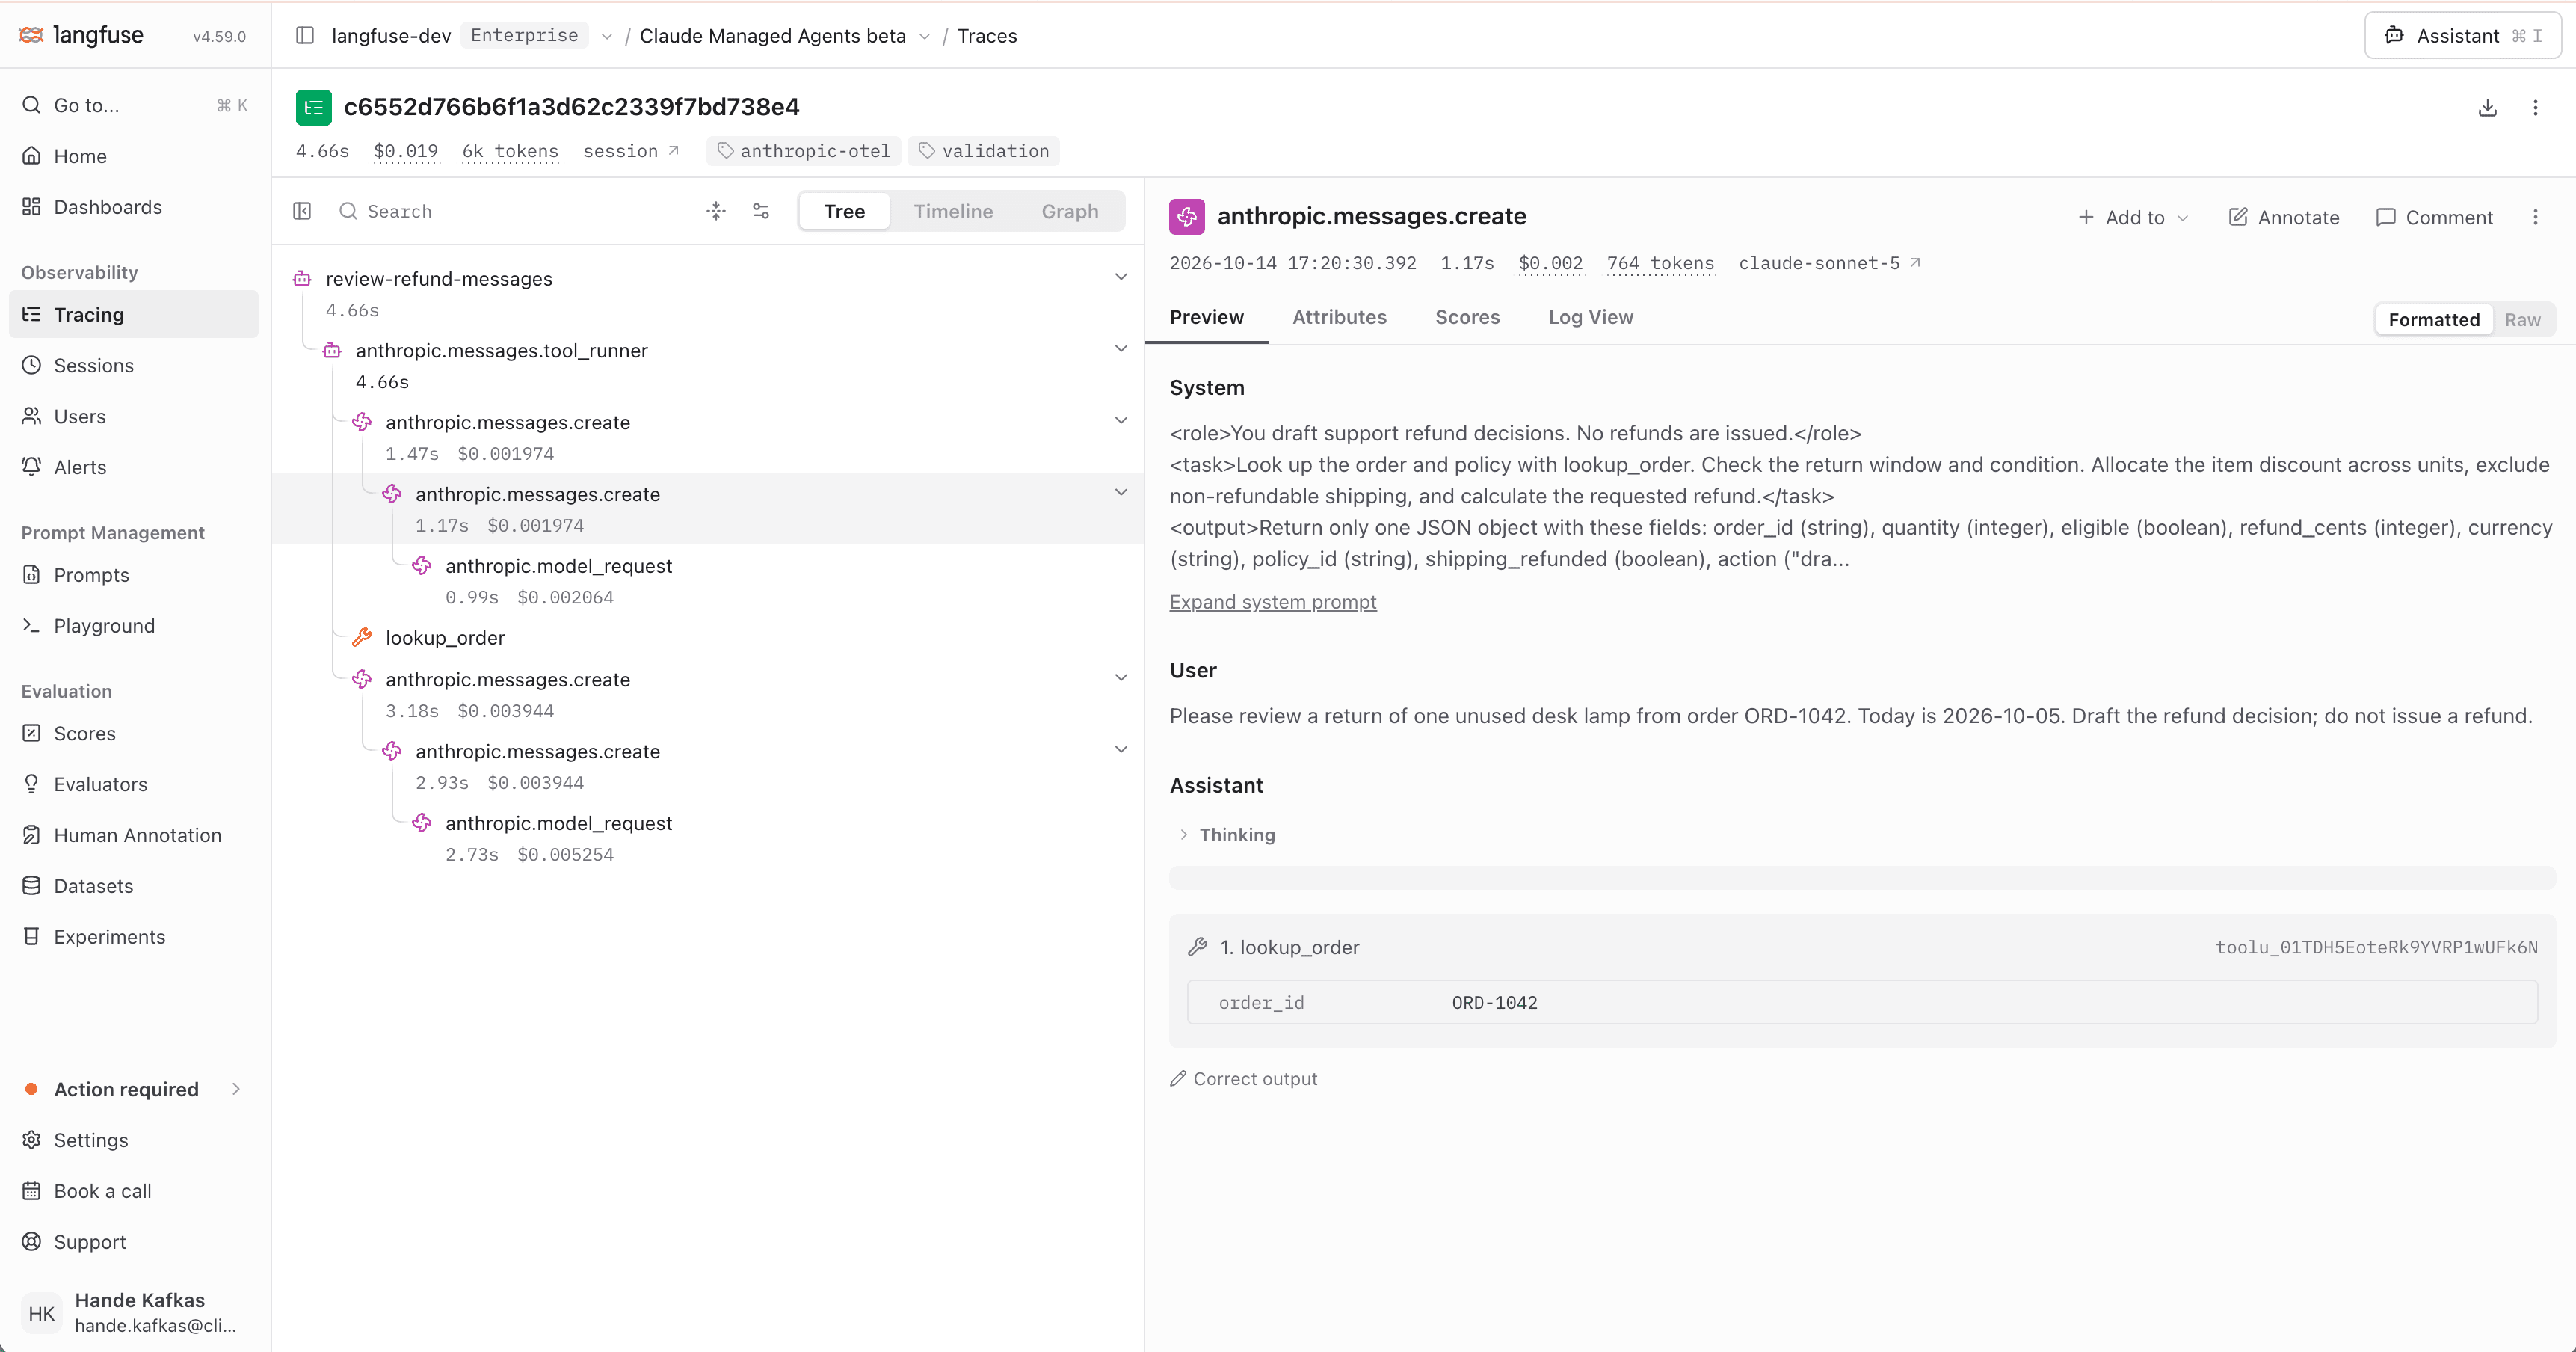
Explore the Messages API example trace.
Claude Managed Agents
Select the agent's turn observation, such as returns-reviewer, to read its input and output. Its child observations show model requests and tool activity. The platform does not export the internal model prompt and response on anthropic.model_request spans. An empty model preview does not mean that content export failed.
Open the session link to see related traces.

Explore the Managed Agents example trace.
The example uses synthetic order data. A coordinator looks up an order and return policy. A separate reviewer checks the proposed refund, writes an audit note, and reads it back. No refund is issued. Select the reviewer's turn to read its content, then select its child model and tool observations to inspect the individual steps.
Count tokens
Messages API token and cost totals in Langfuse can include repeated usage across SDK, server, and model spans. Use the counting rules below to interpret usage.
Anthropic's counting rules say which spans to include:
- Messages API: count one source per request. With platform spans, count either the server request or its model children.
- Managed Agents: count model-request and outcome-evaluation spans.
- For Messages API requests, count compaction usage once. Cache tokens are already included in input tokens; reasoning tokens are included in output tokens.
Turn traces into better agents
Use monitoring to find failures, slow steps, and quality changes in production. Add useful runs to a dataset, define evaluations, and compare changes with experiments before you ship. Repeat this loop as new cases appear, so each release has better evidence behind it.
Further reading
- The AI engineering loop
- Claude Platform OTel setup
- Anthropic span reference
- Langfuse OpenTelemetry integration
- Langfuse is part of ClickHouse
Last updated on
